As of December 31, 2023 , overall Morningstar rating against 700 funds in the Allocation – 50% to 70% Equity category based on risk-adjusted returns.
Strategy Description
The Westwood Capital Appreciation and Income Fund aims to provide total return, through a combination of current income and capital appreciation.
Fund Overview
†Blended Benchmark is 40% Bloomberg U.S. Aggregate Bond Index and 60% S&P 500 Index.
***The subsidized SEC yield is calculated with a standardized formula mandated by the SEC. The formula is based on maximum offering price per share and includes the effect of any fee waivers. Without waivers, yields would be reduced.
**The advisor has contractually agreed to reduce fees and reimburse expenses until March 1, 2025. In the absence of current fee waivers, total return and yield would be reduced.
Assumes an initial investment of $10,000 was made on the fund's inception date of 02/07/2011. The growth of a $10,000 investment in the fund is hypothetical and for illustration only. It does not represent any actual investment.
| Trailing Year Performance | YTD* | 1-Yr Trailing |
3-Yrs Trailing |
5-Yrs Trailing |
10-Yrs Trailing |
Since Inception |
|---|---|---|---|---|---|---|
| Capital Appreciation and Income Fund Net of Fees | 3.51% | 14.36% | 3.92% | 10.84% | 8.68% | 9.66% |
The performance data quoted represents past performance. Past performance does not guarantee future results. The investment return and principal value of an investment will fluctuate so that an investor’s shares, when redeemed, may be worth more or less than their original cost and current performance may be lower or higher than the performance quoted. For performance data current to the most recent month end, please call +1 (877) FUND-WHG. *YTD figure is calculated as of the most recent month end.
*The Adviser has contractually agreed to reduce fees and reimburse expenses until March 1, 2025.
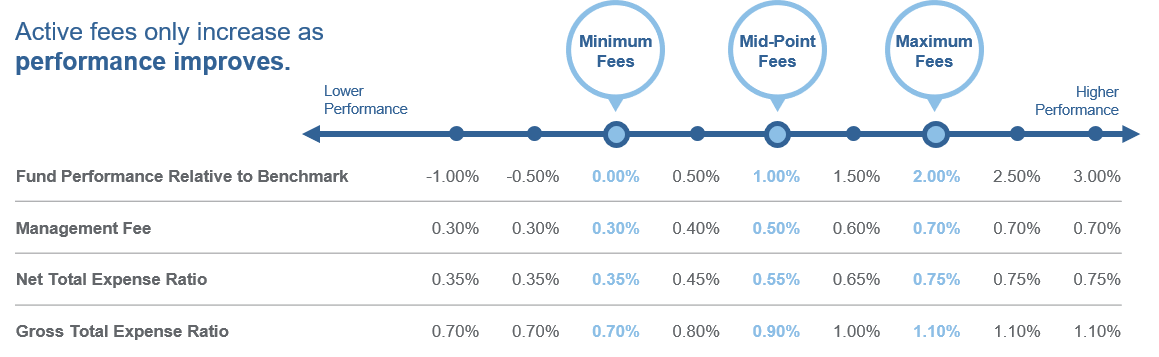
The Base Fee is an annual rate of 0.50%. The Index Hurdle is the Blended 60/40 S&P 500® Index/Bloomberg U.S. Aggregate Bond Index plus 1.00%. The Performance Adjustment is calculated according to a schedule that adds or subtracts 0.0020% of the Institutional Shares’ average daily net assets for each 0.01% by which the performance of the Institutional Shares exceeds or lags the performance of the Index Hurdle over the Performance Period. The maximum Performance Adjustment (positive or negative) will not exceed an annual rate of +/- 0.20% of the Institutional Shares’ average daily net assets during the Performance Period, which would occur when the performance of the Institutional Shares exceeds, or is exceeded by, the performance of the Index Hurdle by 1.00% over the Performance Period.
![]()
![]()
![]()
![]()
Information is for the institutional share class only; other classes may vary.
There are risks involved with investing, including possible loss of principal. There can be no assurance that the Fund will achieve its stated objective. In addition to the normal risks associated with investing, investments in smaller companies typically exhibit higher volatility. Bonds are subject to interest rate risk and will decline in value as interest rates rise. High yield bonds involve greater risks of default or downgrade and are more volatile than investment grade securities. Mortgage-backed securities (MBS) are subject to prepayment and extension risk and therefore react differently to changes in interest rates than other bonds. Small movements in interest rates may quickly and significantly reduce the value of MBS. Derivatives are often more volatile than other investments and may magnify the Fund’s gains or losses. International investments involve risk of capital loss from unfavorable fluctuation in currency values, from differences in generally accepted accounting principles or from social, economic or political instability in other nations. Emerging markets involve heightened risks related to the same factors as well as increased volatility and lower trading volume. Certain securities may be difficult or impossible to sell at the time and the price that the Fund would like. The Fund may have to accept a lower price to sell a security, sell other securities to raise cash, or give up an investment opportunity, any of which could have a negative effect on Fund management or performance.
Copyright © 2024 Westwood Funds
The Morningstar RatingTM for funds, or “star rating”, is calculated for managed products (including mutual funds, variable annuity and variable life subaccounts, exchange-traded funds, closed-end funds, and separate accounts) with at least a three-year history. Exchange-traded funds and open-ended mutual funds are considered a single population for comparative purposes. It is calculated based on a Morningstar Risk-Adjusted Return measure that accounts for variation in a managed product’s monthly excess performance, placing more emphasis on downward variations and rewarding consistent performance. The Morningstar Rating does not include any adjustment for sales load. The top 10% of products in each product category receive 5 stars, the next 22.5% receive 4 stars, the next 35% receive 3 stars, the next 22.5% receive 2 stars, and the bottom 10% receive 1 star. The Overall Morningstar Rating for a managed product is derived from a weighted average of the performance figures associated with its three-, five-, and 10-year (if applicable) Morningstar Rating metrics. The weights are: 100% three-year rating for 36-59 months of total returns, 60% five-year rating/40% three-year rating for 60-119 months of total returns, and 50% 10-year rating/30% five-year rating/20% three-year rating for 120 or more months of total returns. While the 10-year overall star rating formula seems to give the most weight to the 10-year period, the most recent three-year period actually has the greatest impact because it is included in all three rating periods.
As of 12/31/2023: WLVIX was rated against the following numbers of Allocation 70% to 70% Equity funds over the following time periods: 700 funds in the last three years, 658 funds in the last five years, and 493 funds in the last ten years. With respect to the Allocation 70% to 85% Equity funds, WLVIX received a Morningstar Rating of 3 of 5 stars for the three-year period. 5 of 5 stars for the five-year period. 5 out of 5 stars for the ten-year period.
©2024 Morningstar, Inc. All Rights Reserved. The information contained herein: (1) is proprietary to Morningstar and/or its content providers; (2) may not be copied or distributed; and (3) is not warranted to be accurate, complete or timely. Neither Morningstar nor its content providers are responsible for any damages or losses arising from any use of this information. Past performance is no guarantee of future results.
Westwood Funds are distributed by Ultimus Fund Distributors, LLC. (Member FINRA) Ultimus Fund Distributors and Westwood Funds (or Westwood Holdings Group, Inc.) are separate and unaffiliated.
To determine if this Fund is an appropriate investment for you, carefully consider the Fund’s investment objectives, risk factors and charges and expenses before investing. This and other information can be found in the Fund’s prospectus which may be obtained by calling +1 (877) FUND-WHG (+1 (877) 386-3944). Please read the prospectus carefully before investing.