
The long-term total return and alpha potential of the small cap asset class is well-documented by institutional investors. Long-term performance over the last 20 years for the small cap asset class has outperformed the large cap asset class annually by 0.98% with 92% of active managers outperforming their respective benchmarks. As we look forward, we will discuss how current market dynamics are impacting the small cap asset class while outlining why the SMIDCAP asset class should be considered by the next generation of DC investors pursuing an active allocation to small cap.
Potential Benefits of SMIDCAP Allocation for DC Plans
- Superior risk-adjusted returns and manager alpha potential
- Stronger fundamentals as it relates to quality attributes which may be more critical in the next market cycle
- Can help solve for manager capacity constraints and allow sponsors to drive increased scalability
- Can improve investment diversification
- Better investment option for white-label funds utilized by larger plans to create simpler decisions or to create more degrees of freedom for participants
- Smaller plans with fewer assets are potentially missing the “sweet spot” in the mid cap asset class with limited plan options in large cap and small cap
- Plan simplification allows for the reduction of participant decision points and the number of plan options across the mid and small cap asset classes
- Plan simplification allows for the reduction in plan costs by pairing manager rosters
- Potential to lower investment manager fees
Small cap performance enjoyed nearly a decade of secularly strong performance since the recession lows of 2009 and through 2019. Despite the strength, fundamentals deteriorated meaningfully for the types of small companies held by the index with the most recent move lower exacerbated by the global pandemic in 2020. While some improvement may unfold as the economy reopens, the trend has clearly been toward lower quality companies. The proportion of companies that failed to turn a profit has now risen to 47% of the Russell 2000 Index as debt-servicing costs hover around their highest level in 20 years. The Fed has continued propping up credit markets, keeping interest rates low, and allowing low-quality companies to muddle along and survive longer.
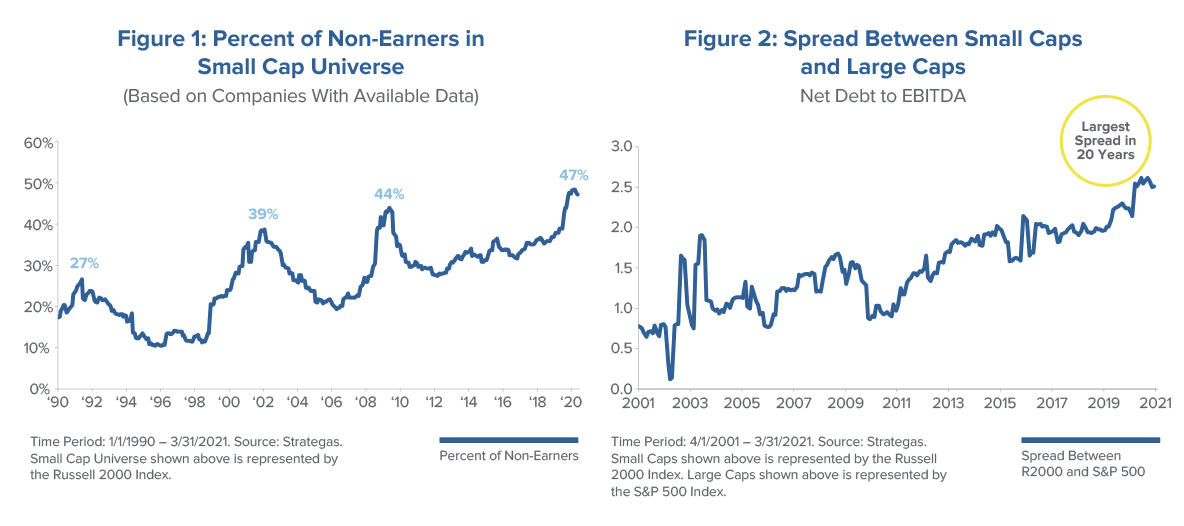
Businesses continue to face daunting operating risks between the fallout from the coronavirus and the aging demographic shift underway. We believe this will bring an increased emphasis on quality at both the strategy and asset class level by fiduciaries as higher quality businesses will be best able to navigate these dynamics. We expect prudent asset allocators to overweight strategies with a higher return on capital, solid balance sheets and stronger free cash flow; underlying companies with such attributes can deploy their excess cash and utilize their attractive cost of capital to invest for a successful future. As such, the time is right for a gradual shift in thinking by DC plan sponsors to consider the SMIDCAP asset class with a greater focus on achieving a superior risk-return profile with better resiliency in market corrections and a greater ability to allow “winners” to mature into mid cap stocks.
- The SMIDCAP asset class has posted superior risk-adjusted returns relative to small caps at a lower volatility
- Medium-sized businesses typically offer a greater degree of quality attributes and financial stability than small cap stocks with similar inefficiency
- A larger opportunity set is an ideal backdrop for active management to find higher quality and undervalued securities
- Potentially a better benchmark for small cap active managers who are not “true small cap”
Defining the SMIDCAP Opportunity Set
In the United States, the most commonly used SMIDCAP benchmark is the Russell 2500 Index. The Russell 2500 Index includes market capitalizations that range between $49 million and $32 billion, with a median that is now $1.54 billion. The Russell 2500 Index includes all the stocks within the Russell 2000® Index plus the 500 smallest cap stocks from the Russell Midcap® Index, therefore, providing a greater opportunity set for investors.
Figure 3: Index Characteristics
| Fund | # of Stocks | Weighted Avg. Mkt Cap ($B) |
Median Mkt Cap ($B) |
Smallest Mkt Cap ($B) |
Largest Mkt Cap ($B) |
| Russell 2000 | 2056 | 3.61 | 1.04 | 0.05 | 18.19 |
| Russell 2500 | 2566 | 7.11 | 1.54 | 0.05 | 31.60 |
| Russell Midcap Value | 707 | 19.92 | 9.65 | 0.70 | 55.90 |
| Russell 1000 | 1023 | 417.61 | 13.80 | 0.70 | 2054.96 |
The wider opportunity set in SMIDCAP includes small cap stocks and a segment of mid cap stocks allowing for greater alpha and total return potential as managers are not forced to sell their winners as they mature and grow. This is a potentially important benefit for longer-term buy and hold DC investors or target date allocations that otherwise would be negatively affected if they are forced to sell winning companies in a pure small cap portfolio. Depending on the size of the plan sponsor or sophistication of plan participants, the flawed assumption of simply owning a large cap and a small cap strategy benchmarked to the S&P 500 and Russell 2000 Index has created a portfolio gap in the “sweet spot” of the market — mid cap stocks. For plan sponsors following the trend of simplifying plan options while reducing participant decision points, utilizing the SMIDCAP asset class can help mitigate investors’ tendency to underweight the mid cap segment of the market and avoid risking missing out on potential long-term gains. The larger opportunity set across mid caps and small caps also helps solve for capacity constraints often found with managers who maintain proven track records in the small cap segment of the market which is critical for larger plans that require increased scalability for participants.
SMIDCAP investors may also benefit from growth in the private equity market which has led to growing companies remaining private for a longer period, entering the public market at a size larger than would be considered for the Russell 2000 Index. While stock performance of companies post-IPO can obviously vary, Dunkin Brands, ETSY and BJ’s Wholesale Club are recent examples of strong performing companies that came to the market as mid cap stocks through March 31, 2021, which bypassed fundamental stock pickers dedicated to the small cap arena. As IPOs come with market capitalizations larger than the Russell 2000 Index, it narrows the opportunity set traditional small cap investors have historically enjoyed.
SMIDCAP’s Fundamental Appeal
Westwood strongly believes in the small cap asset class as part of a long-term strategic asset allocation for institutional investors. As we consider specific solutions and current trends for DC plan sponsors, SMIDCAP’s fundamental appeal vs. small cap in aggregate stems primarily from the addition of the mid cap segment that bridges the two asset classes together. As illustrated in Figure 4 below, the roughly 500 mid cap companies that are not in the Russell 2000 Index drive significant improvement in key quality metrics. As of June 30, 2021, you can see SMIDCAP has stronger quality attributes with higher return on equity, stronger free cash flow and less leverage. This relationship to the Russell 2000 Index has been relatively consistent historically and is potentially the catalyst for SMIDCAP maintaining a more attractive risk-return profile over the long term. From a value perspective, the Russell 2500 Index is also more attractive with higher forecasted earnings growth of 9.27% and lower price-to-earnings ratio.
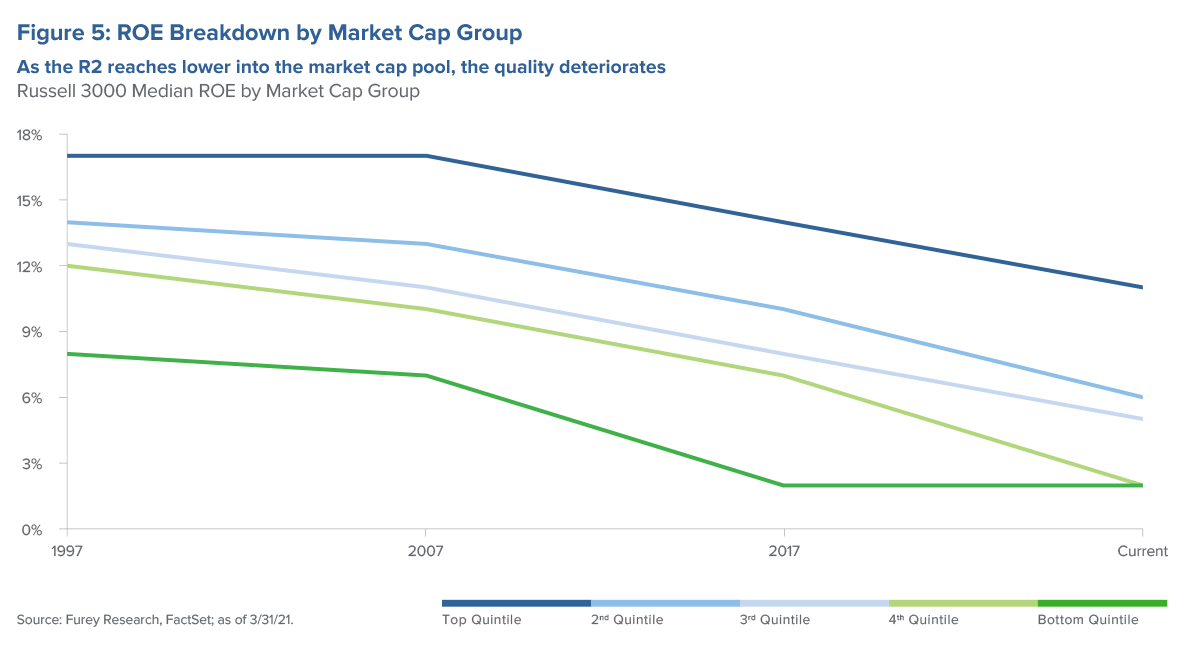
While Modern Portfolio Theory would infer the riskier asset class (i.e., small cap) growing faster with more potential upside, we continue to see a deterioration in quality and earnings power in the lower end of the small cap asset class (see Figure 5). Since the recession lows in 2009, the “lowest market cap” in the Russell 2000 Index, which had risen to the $120 million to $150 million range, has now dipped to just under $50 million, which is the lowest reading since the Financial Crisis. As we discuss changes in market dynamics, the danger of this environment is the accompanying decline in overall quality/profitability. This elevates the importance of DC plan sponsors’ emphasis on quality going forward, particularly for value investors, as well as highlighting the appeal of the SMIDCAP asset class.
Figure 4: Small Cap and SMIDCAP Index Characteristics
| Characteristics Summary | Russell 2000 | Russell 2500 |
| # of Stocks | 2056 | 2566 |
| Free Cash Flow Margin | 3.23% | 4.20% |
| ROE | -0.54% | 4.32% |
| Net Debt/EBITDA | 2.22x | 2.06x |
| Free Cash Flow Yield | 1.03% | 1.57% |
| Forward P/E Ratio | 29.61x | 24.37x |
| P/E to Growth | 6.26x | 2.63x |
| Forecasted Growth Rate | 4.73% | 9.27% |
- Higher ROE
- Higher Free Cash Flow
- Lower Debt
- Higher Forecasted Growth Rate
- Lower PE Ratio
For Westwood’s Value Equity Team, the SMidCap Strategy offers greater access to higher-quality, undervalued SMIDCAP stocks with a deeper pool of candidates than the pure small cap universe. The decision to launch SMidCap in 2002 was to create a separate and distinct strategy versus simply allowing our SmallCap Value portfolio to overextend its capacity into the mid cap segment of the market. Our bottom-up research ideas include high-quality businesses across small caps, mid caps or larger cap fallen angels that currently trade below their intrinsic value up to approximately $15 billion in market cap. Westwood’s breadth of research coverage enhances our ability to invest at the intersection of quality and value, where we believe a return premium exists with limited absolute downside risk across the small cap and mid cap spectrum. We seek to invest in businesses with better management depth, longer operating histories, better access to capital and a greater ability to scale their businesses. In aggregate at the strategy level, we believe our SMidCap portfolio companies can more readily adapt to changing business conditions or competitive threats which we believe will be essential in the new market environment as market dynamics and market structure evolve.
Superior Risk-Adjusted Returns
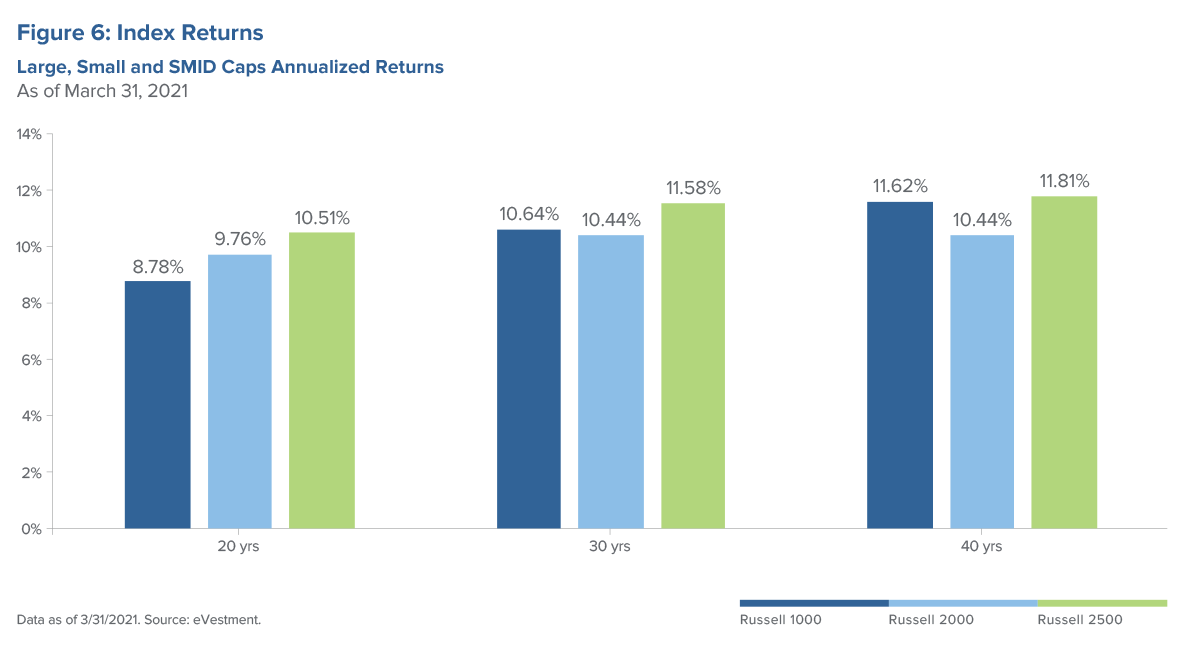
Historically, the SMIDCAP asset class has been nothing short of impressive, outperforming both large caps and small caps when observing 20-, 30- and 40-year time periods (Figure 6). The SMIDCAP asset class also achieved superior risk-adjusted performance with less volatility in the Russell 2000 Index with better performance in periods of economic distress. Qualitatively, this is not surprising as you would expect more stable businesses and higher-quality balance sheets to experience less cyclicality and vulnerability during periods of economic distress vs. a pure small cap asset class.
Another important proof point for DC plan sponsors and asset allocators when considering the common traits and tradeoffs between SMIDCAPs and small caps is correlation. Both asset classes have a correlation of 0.99 over the last 10 years, respectively. Both asset classes have also been proven diversifiers vs. large caps with correlations of 0.95 for SMIDCAP and 0.92 for small cap relative to the S&P 500 Index over the last 10 years. It is worth noting that we believe active manager allocations, especially those that follow a growth or value style, can potentially be even more diversified over the long term.
- 10-Year Period
- 20-Year Period
- 30-Year Period
Strong Alpha Generation by Active Managers
SMIDCAP managers have done a solid job of outperforming long term across core, value and growth disciplines. For the 10- and 20-year periods, we saw the median manager beat the benchmark by 0.59% and 1.33%, respectively, on an annual basis. Top quartile performers beat the benchmark by 1.87% and 1.89% annually over the same time periods, respectively. It is important to note that the median active manager across the 10-, 20- and 30-year periods also achieved superior risk-adjusted performance with less volatility than the index. While both core and growth styles have impressive long-term records of success as it relates to alpha generation, SMIDCAP value managers showed the highest alpha spread relative to the index when observing the magnitude of excess returns by median managers.
Figure 7: SMIDCAP Active Managers’ Track Record of Outperformance
| 10-Year Period | 20-Year Period | |
| % of Managers Outperforming the Benchmark | 71% | 81% |
| Median Manager Excess Returns | 0.59% | 1.33% |
| Top Quartile Manager Excess Returns | 1.87% | 1.89% |
Summary
In our view, SMIDCAP is well-suited for the next generation of active small cap DC plan investors. By including small and mid-sized companies, SMIDCAPs offer the total return and alpha potential of the small cap asset class with higher quality attributes, a superior risk-return profile and potentially more optionality in a post-vaccine world as changes in market dynamics and market structure continue to evolve. Additionally, the SMIDCAP asset class offers asset allocators and plan sponsors potential efficiencies as the industry demands greater scale and capacity, more simplified plan options and lower costs.
The Westwood U.S. Value Equity Team has been managing the SMidCap Strategy since 2002 by investing at the intersection of quality and value. We currently manage over $722 million, offering both institutional separate accounts and commingled vehicles.