Looking at today’s energy sector of oil and natural gas, there’s an inevitability of uncertainties accepted by both consumers and those within the industry. To gain a better understanding of these energy sources, it’s necessary to analyze the foundational elements that often cause these changing variables. We do this by focusing on factors such as the key drivers of energy, supply and demand, and production.
Oil | Global Supply and Demand, Demand Drivers and Decreasing Inventories
Global Supply and Demand
One large impacting force on the energy sector is the evolution of supply and demand. According to the International Energy Agency (IEA), demand from 2019 to present has fluctuated from 99.5 million barrels a day, down to 90.9 million barrels a day, and returning to 99.7 million barrels a day. These demand projections also vary between the U.S. Energy Information Administration (EIA) and OPEC. Both the U.S. EIA and OPEC reflect 2019 demand as a minimum of 100.0 million barrels per day, with the U.S. EIA projecting 100.3 million and OPEC at 100.0. Regarding present demand, the U.S. EIA reports 102.3 million barrels per day, an increase of 1.3 million from October 2021, and OPEC at 100.8 million barrels per day.
More recently, compared to 2020, there has been an estimated growth of between 8.7 to 10.4 million barrels of oil per day for 2021 and 2022. We determine the key drivers of this growth to be global oil demand, OPEC+ supply/restraint, U.S. supply growth, non-OECD supply and inventory levels.
Projecting forward to 2022, the U.S. EIA and OPEC agree that demand will be higher than it was in 2019. While the IEA has lagged in providing updated demand predictions behind the U.S. EIA and OPEC, recent revisions have the IEA moving to a more forward position.
Important Demand Drivers
Another necessary insight into the energy sector is found by studying what, and who, are the biggest drivers of oil demand. The U.S. is the top global consumer of oil, using 20.5 million to 21 million barrels per day. In 2022, China will surpass Europe as the second largest consumer, using over 16 million barrels per day. India is the third largest global consumer, using more than 5 million barrels per day. These top three consumers account for over 40% of demand, making them critical for observation.
Looking at the U.S.’ supply, we exited October 2021 producing an average of 11.473 million barrels per day. Predicting for 2022, this number could increase anywhere from 0.8 million to 1.5 million barrels per day.
As for OPEC, members and select non-OPEC members have begun to restore previously cut production, a process which is expected to take until mid-2022. Many of these cuts have come from Saudi Arabia, Russia and the U.A.E., with Saudi Arabia and Russia contributing to most of the reduction in supply. Two factors that also added to global reduction were lower Iranian exports and lower Venezuelan production, along with Libya outages, and Angola and Nigeria’s own production issues.
Going forward, there are multiple areas to watch as we continue to monitor oil’s presence and status. The first is the U.S.’ supply growth, which is approximately at 1 million barrels per day, and the potential of an oversupply in the second quarter of the year. In the near-term, it is also important to watch China COVID-19 daily case rates, with the potential risk of broadening shutdowns across the country or changes to the zero COVID-19 policies currently in place.
We also continue to observe the ineffectiveness of the U.S.’ sanctions, whether Iran and Venezuela will continue to grow exports and shortfalls in areas such as Nigeria, Libya and Angola. Presently, it seems Libya has returned to their newer-normal levels, while Nigeria and Angola seem less likely to grow production back to their previously determined quota levels. Russia and Saudi Arabia will also prove meaningful to watch, as the question looms as to what levels they can produce once the OPEC+ deal — a deal between OPEC and additional countries, primarily Russia, Kazakhstan and eight others, made in 2020 to cut supply to the market in response to the pandemic — ends.
Decreasing Inventories
Similar to supply and demand drivers, decreasing inventories are also a focal point of the industry. As of 2021’s end, OECD inventories were approximately 2.73 billion barrels down from the peak at the end of second quarter 2020. We are now tracking near the five-year average.
OPEC+ has a goal of 2.75 billion barrels, which was reached in fourth quarter 2021. U.S. commercial inventories are now at 413.8 million barrels as of Jan. 14, 2022, tracking below the five-year average by 8%. Overall, these inventory levels are bullish for oil prices.
Conclusions on Oil
There are many aspects to account for when observing the energy sector, specifically looking to oil. Global inventories have continued to decline, and we are entering a balanced environment. Regarding prices, we are generally constructive.
Previously, due to oversupply concerns, OPEC+ decided to collectively decrease production by 1.2 million barrels per day. These cuts are now being reversed in orderly fashion, and demand has come back with acceleration and global growth in many instances, not accounting for the outbreak of COVID-19 variances.
For these reasons, in 2022, we envision strong demand growth. The U.S. rig count has increased year to date, and we expect it to trend higher through the year. E&Ps have also shown early indications of capital discipline, which has come at a surprise to those watching the sector. We’ve begun to see a “Goldilocks” scenario, where demand is strong, supply is constrained outside of OPEC+ and global inventories look good.
Natural Gas | Fundamentals and Production
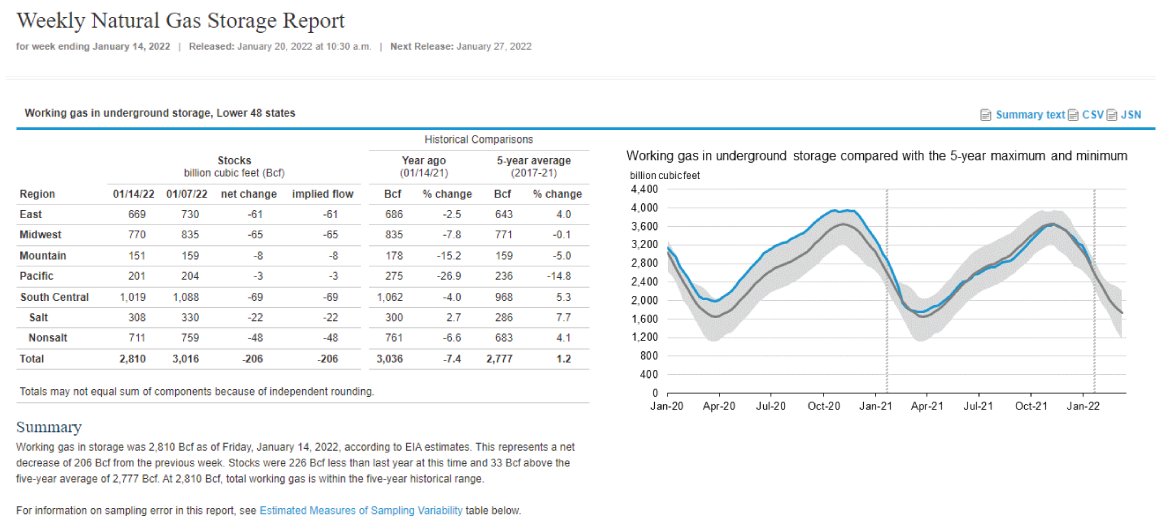
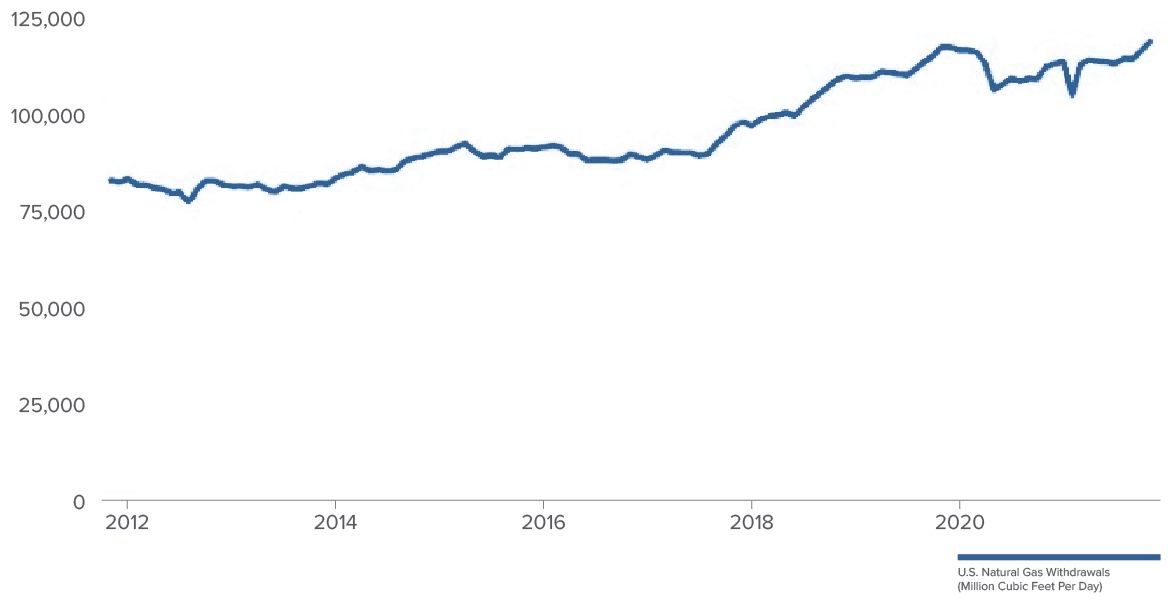
Pivoting to natural gas, production resumed in November 2021, according to the latest data, at 118.3 Bcf (billion cubic feet) per day, up 2.0% sequentially, surpassing the prior peak for the first time of 116.98 Bcf in November 2019. Demand is reflecting strong, with liquefied natural gas exports and electric generation, and storage levels at 2.81 Tcf (trillion cubic feet), which is a bit below last year and very close to the five-year average.
Conclusions on Natural Gas
The outlook on natural gas is a positive one, with producers starting to grow with supply in the single digits, and demand continuing at a reasonable level, sitting at a much more balanced place than six months ago. In addition, inventories are in reasonable shape relative to both last year and the five-year average. The natural gas markets will be dependent on seasonal weather patterns, but the fundamental outlook skews modestly positive, with Europe looking to diversify its natural gas supplies away from Russia.
U.S. Natural Gas Production (Gross Withdrawals)
Million Cubic Feet Per Day
Energy | Expectations
In conclusion, we see the oil market as balanced, with OPEC+ increasing supply gradually and demand strengthening. We have concerns over excess supply starting in the spring; however, we see the natural gas market balanced, though weather dependent. Either a cold winter or hot summer could lead to price spikes. We think there is approximately a $5 risk premium in oil currently, due to the geopolitical events occurring worldwide.
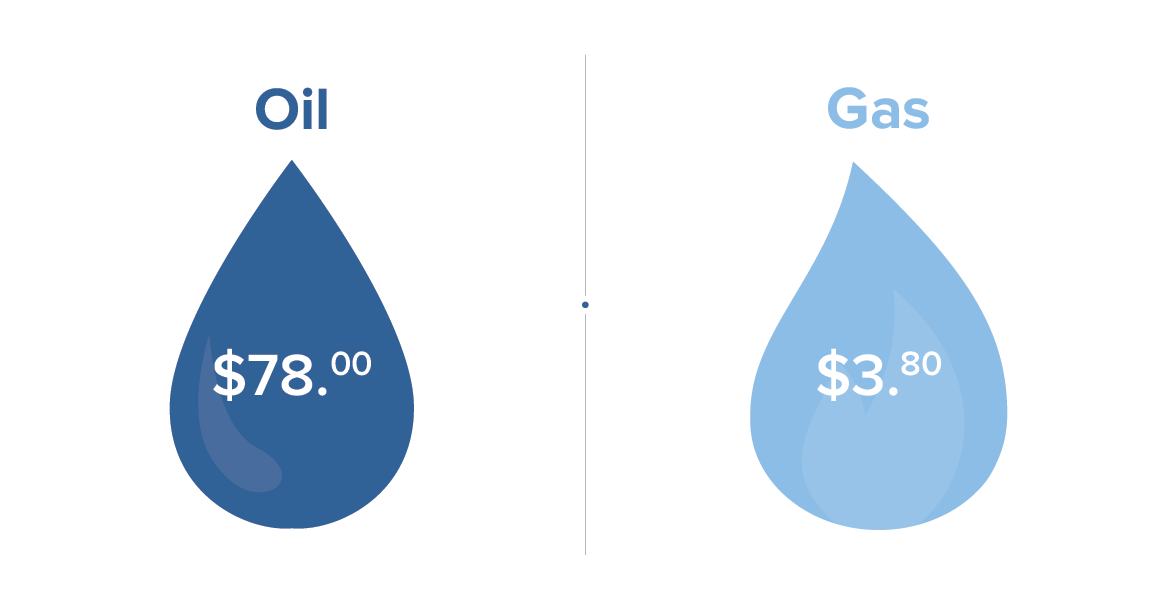
As for trading, we believe oil will trade in the $60 to $80 range in 2022, with a bias to the high end, and we believe natural gas trades between $3 and $4.25, with a mid-point more likely.
With entities such as the energy sector, one can never pinpoint exactly what’s to come in the foreseeable future. However, with these measures and observations, there is knowledge and assurance to be found to help lessen the uncertainties and bring more clarity to the industry.
Energy | Single Point Price Estimates