Now might be the time to consider small-cap stocks again.
For seven straight years, large cap stocks have outperformed small-caps – and 2023 was a blowout, as the large-cap Russell 1000 Index beat the small-cap Russell 2000 Index by 9.60%.
But the trend goes even further – nine of the last ten years, even 14 of the last 19 calendar years have ended in favor of large-cap stocks. The last sustained run of small-cap dominance was 1999-2004, when the Internet was still relatively new, the dot-com bubble was breaking, and the Dallas Cowboys had only recently won the Super Bowl.
Small-cap stocks staged a rebound in the fourth quarter to end 2023 on a high note. Does the recovery portend a small-cap renaissance in 2024 and beyond?
Why Small Caps?
It’s long been common investment knowledge that small-cap stocks have historically outperformed large-cap stocks.
But is it? The “size premium” that had been part of the lure of small-caps has seemingly been nullified. The domination of large caps is clear: for nearly every trailing five-year period for the past forty-five years, large-cap stocks (measured by the Russell 1000 Index) have outperformed small-cap stocks, represented by the Russell 2000 Index.
If this relationship continues, then it would upend one of the foundational tenets of investing: that investors are compensated for taking on additional risk. Smaller companies are inherently riskier than larger companies, and investors expect to be compensated for that risk.
| 4Q 23 | 1 Year | 5 Years | 10 Years | 15 Years | 20 Years | 25 Years | 30 Years | 35 Years | 40 Years | 45 Years | |
|---|---|---|---|---|---|---|---|---|---|---|---|
| Russell 1000 | 11.96 | 26.53 | 15.52 | 11.80 | 14.02 | 9.78 | 7.72 | 10.18 | 10.83 | 11.29 | 11.97 |
| Russell 2000 | 14.03 | 16.93 | 9.97 | 7.16 | 11.30 | 8.11 | 7.91 | 8.56 | 9.32 | 9.14 | 10.97 |
| Difference | 2.07 | -9.60 | -5.55 | -4.65 | -2.72 | -1.67 | 0.19 | -1.62 | -1.51 | -2.15 | -1.01 |
Why Now?
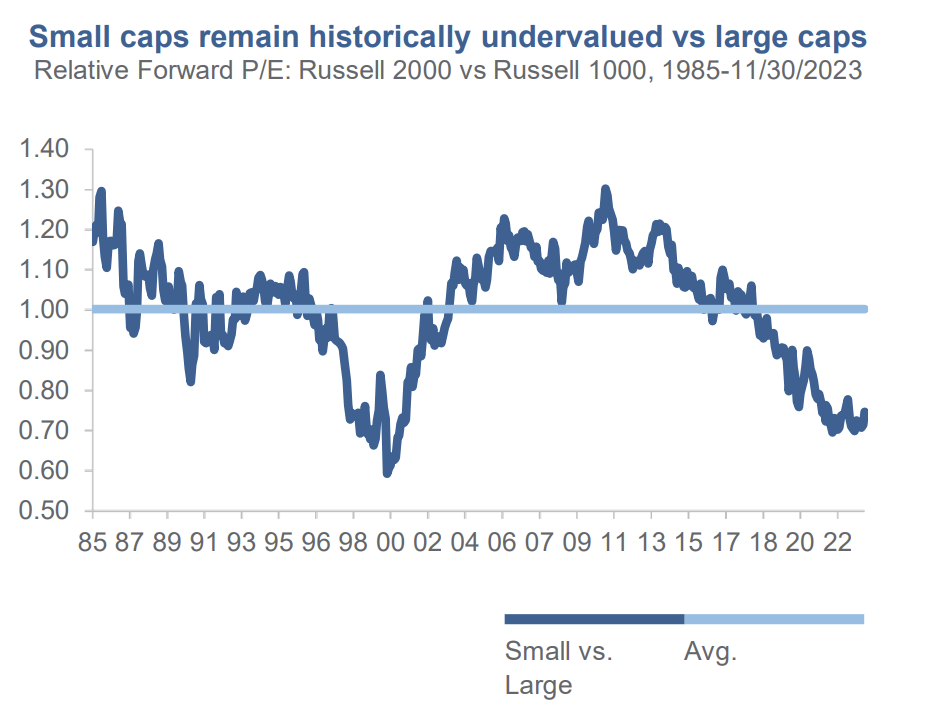
1 Small-Cap stocks are historically undervalued. Relative to large-cap stocks, small-cap stocks are at historical low P/E ratios, providing them ample room for potential appreciation.
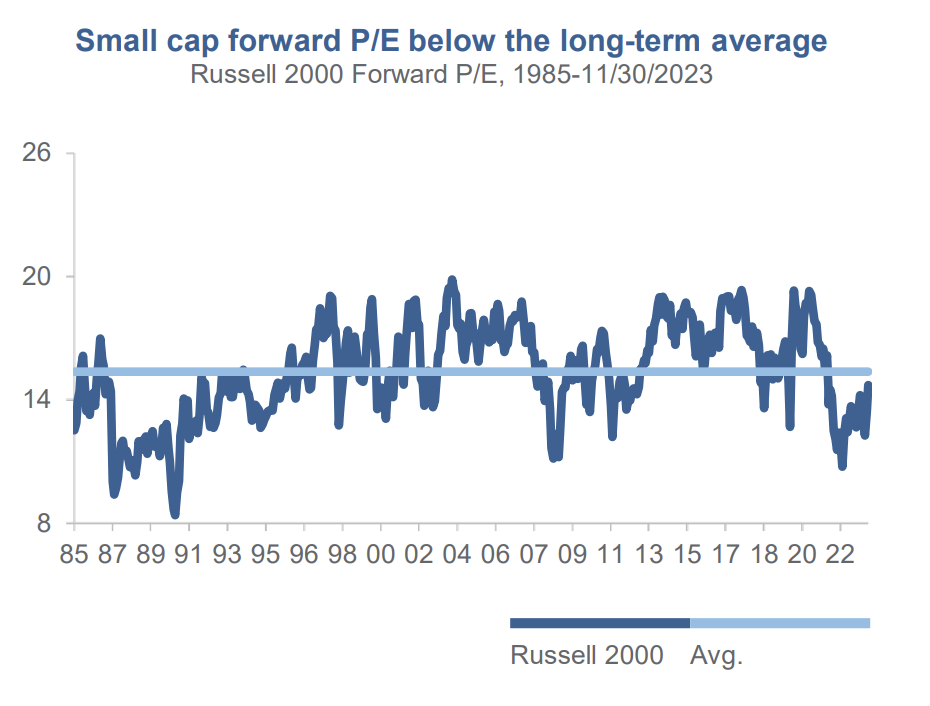
BofA Global Research, Small/Mid Cap Valuations, 12/13/23. Past performance is not indicative of future results. Indexes are unmanaged, do not incur management fees, costs and expenses, and cannot be invested in directly. The index is unmanaged and is not available for direct investment.
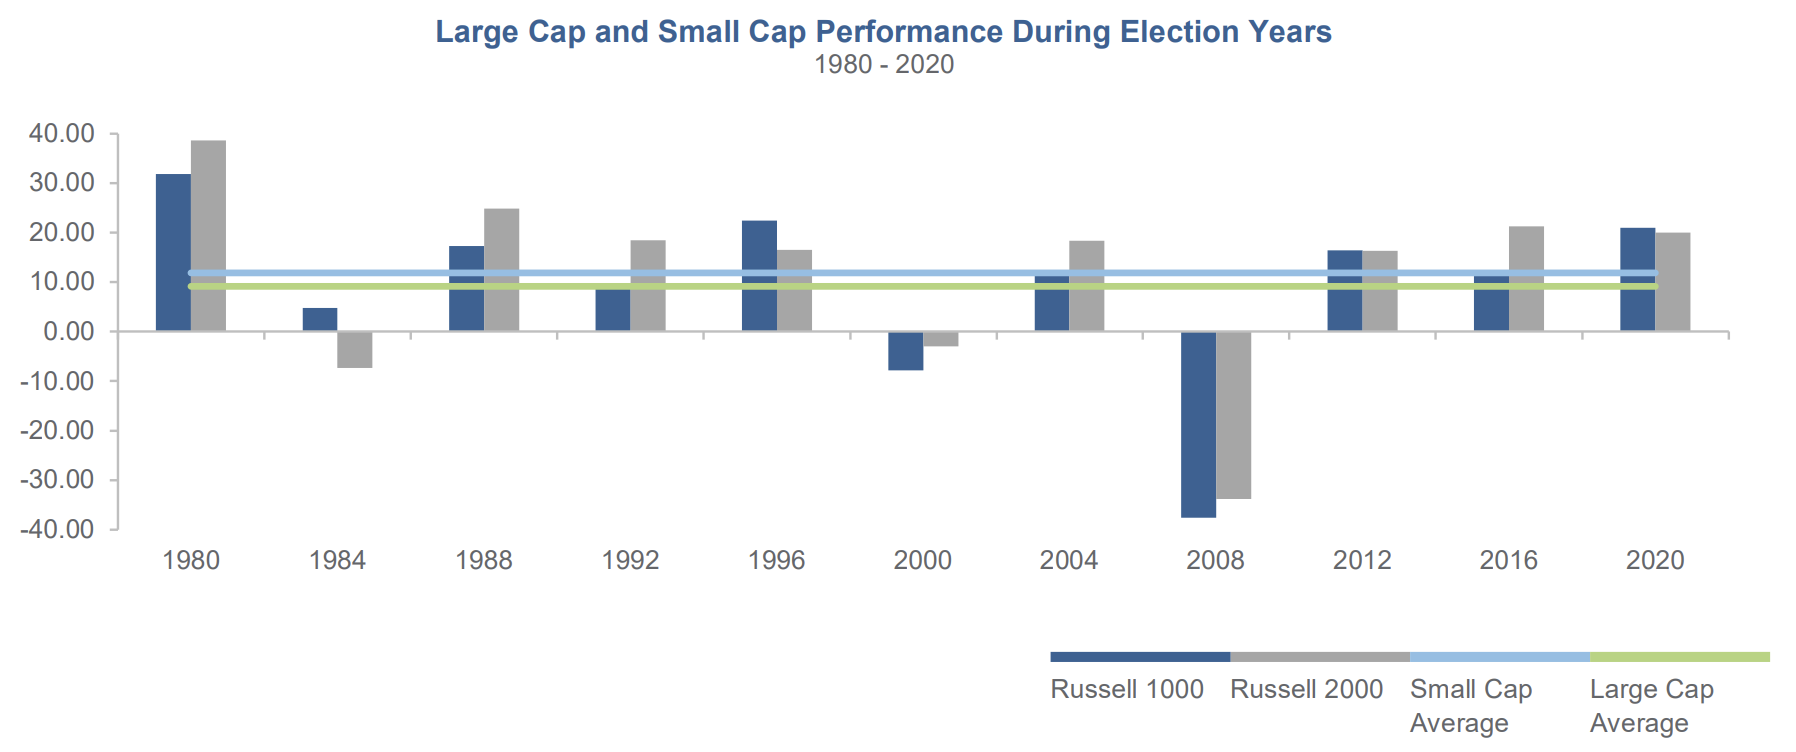
2Presidential election years have been good for small-cap outperformance. Historically, small-caps have outperformed seven of the eleven election years, and by an average of 2.68%.
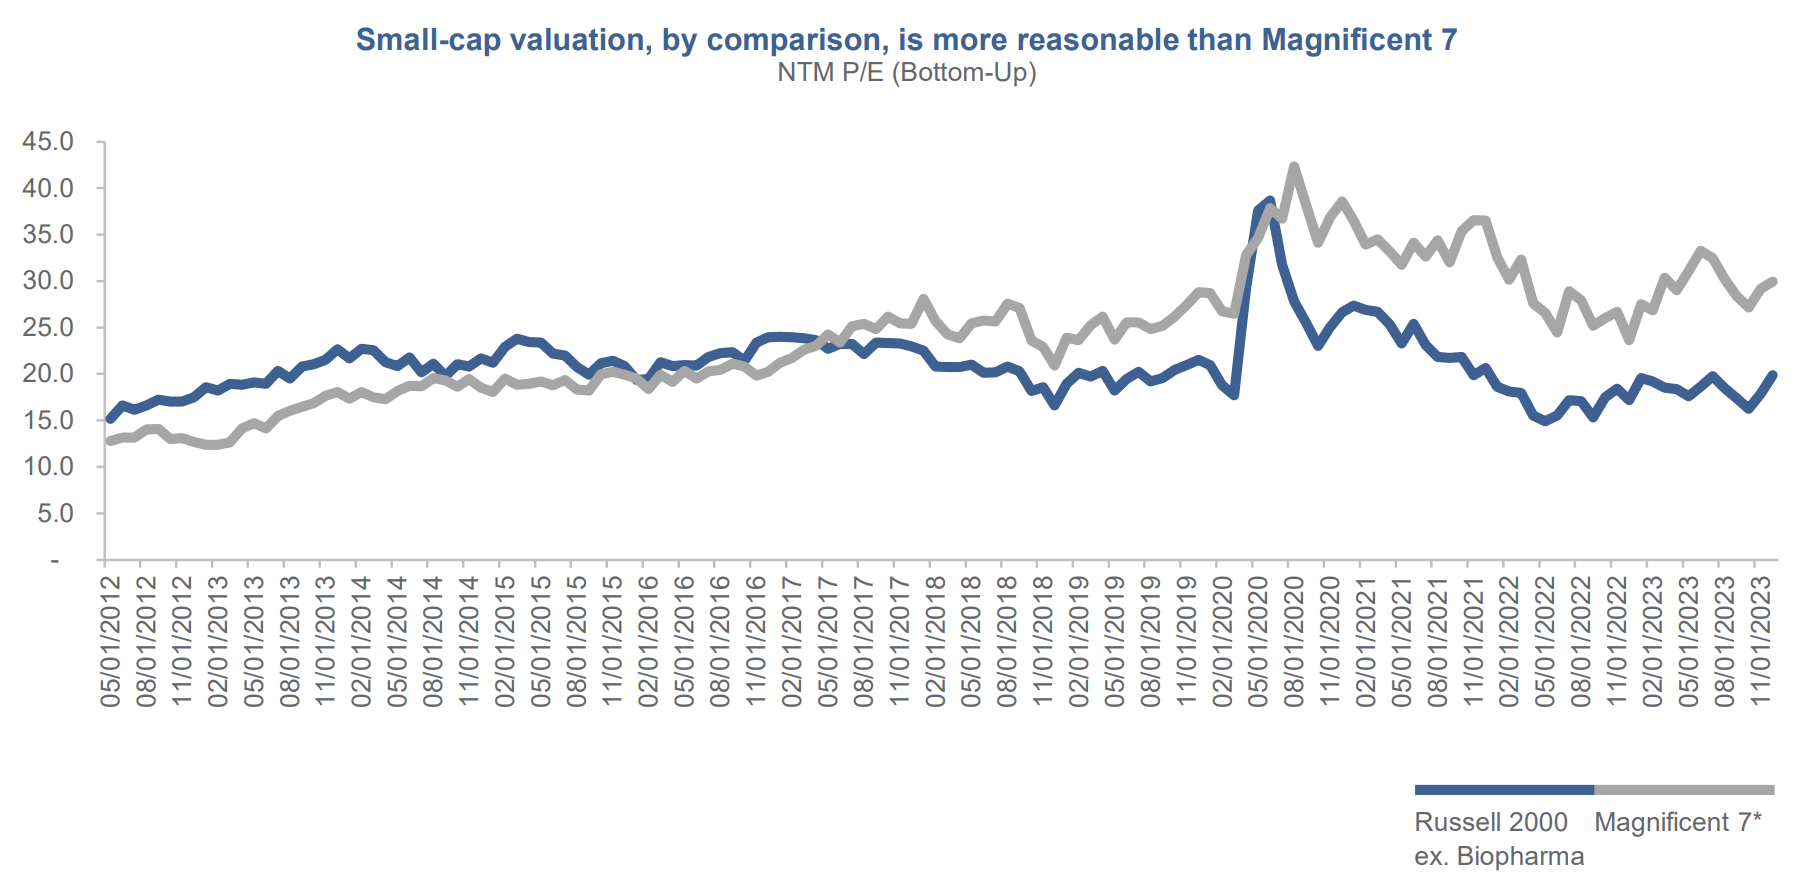
3Small-Cap (ex-biotech) earnings are expected to grow faster than the Magnificent Seven. The growth case for small caps shows earnings growth the next two years greater than the Magnificent Seven, and at a lower P/E ratio.
Why Westwood Small Cap Value?
The initial phase of a market rebound tends to benefit everyone – a low-quality rally. That’s what happened in the fourth quarter, as lower-quality, high-beta and non-earning companies sparked the fourth-quarter returns in small-cap stocks.
As the bull market matures, investors tend to seek quality and sustainability of earnings. After the initial rising tide lifting all boats, investors typically will start to sort the wheat from the chaff, placing a greater emphasis on earnings, profitability, and sustainability. This is when our investment process tends to shine, as we share that focus on quality.
In 2024, we expect to see small-caps rebound, and we believe that the companies that meet our investment criteria – quality businesses with strong balance sheets and sustainable metrics, and undervalued relative to peers or the market – may have a strong year.
Westwood SmallCap Value Strategy
Standardized Performance
| 4Q 23 | YTD | 1 Year | 3 Years | 5 Years | 10 Years | Since Inception | |
|---|---|---|---|---|---|---|---|
| Westwood SmallCap Value Gross of Fees (Inception: 1/1/2004) |
15.28% | 18.25% | 18.25% | 10.54% | 12.30% | 8.86% | 10.92% |
| Westwood SmallCap Value Net of Fees | 15.07% | 17.38% | 17.38% | 9.61% | 11.31% | 7.84% | 10.12% |
| Russell 2000® Value Index | 15.26% | 14.65% | 14.65% | 7.94% | 10.00% | 6.76% | 7.68% |
*Inception Date: 1/1/2004. Past performance is not indicative of future results. Indexes are unmanaged, do not incur management fees, costs and expenses, and cannot be invested in directly. Data Source: © 2023 FactSet Research Systems Inc. All Rights Reserved. Please see appendix for full performance disclosures. The disclosures provided are considered an integral part of this presentation. Past performance is not indicative of future results. Indexes are unmanaged, do not incur management fees, costs and expenses, and cannot be invested in directly. The index is unmanaged and is not available for direct investment.