
Introduction
Retirement plans are constantly evolving. From traditional defined benefit pension plans to the now ever-present, participant-directed 401(k) plans, change has been a constant factor. Defined contribution (DC) plans are still shifting and changing, in part due to legislation, and in other ways due to participant demand.
Over the past few years, many steps have been taken to enhance and redefine DC plans. Some actions include encouraging more participation and protecting participant accounts, all in the name of ensuring participants have the resources they need to retire. In the latest evolution of defined benefit plans, administrators have been encouraged to focus on outcomes, by looking at the four phases of a participant’s retirement journey. Each of these phases requires careful thought and consideration to ensure that plan participants understand where they are and how they’re doing along the way.
When designing plans for participants, administrators must include strategies that are suitable for participants in all four phases of the retirement journey — long-term investments for accumulation, lower-volatility strategies for preservation, and more stable, income-oriented solutions for the distribution and wealth transfer stages. It’s a lot to consider, and many plan administrators are seeking simplicity as they build out solutions for their participants.
For plan administrators looking to provide a complete solution set to participants, while at the same time simplifying the plan and encouraging participation, the small-mid cap asset class (SMID-cap) may be an option to consider. The SMID-cap asset class provides an attractive alternative to small-cap or mid-cap stocks, it can solve for capacity restraints common to small-cap managers, and it can provide additional diversification for participants. Further, the SMID-cap asset class is attractive now, after facing the bear markets of 2020 and 2022, and poised for potential outperformance in the years ahead. Last, there are certain metrics that seem to indicate the possibility of attractive performance ahead for SMID-cap stocks, including the potential tailwind of quality, a hallmark of the Westwood investment process.
Investment Options in a Defined Contribution Plan
When considering investing options within DC plans, consultants and fiduciaries are faced with many choices. Of first concern should be developing a broad menu of investment choices that reflect the scope of the stock and bond markets, while limiting the available options to a reasonable list for participants. Asset class performance is a consideration, but it should be one of many factors.
Investment cost should also be a topic, as fiduciaries should seek investment choices that provide attractive value to participants — not necessarily the lowest-cost option. And the decision matrix for large plans likely differs from that of smaller plans, as participant demands are varied and unique depending on the size of the plan. The SMID-cap asset class may solve many of these questions for plan sponsors and fiduciaries.
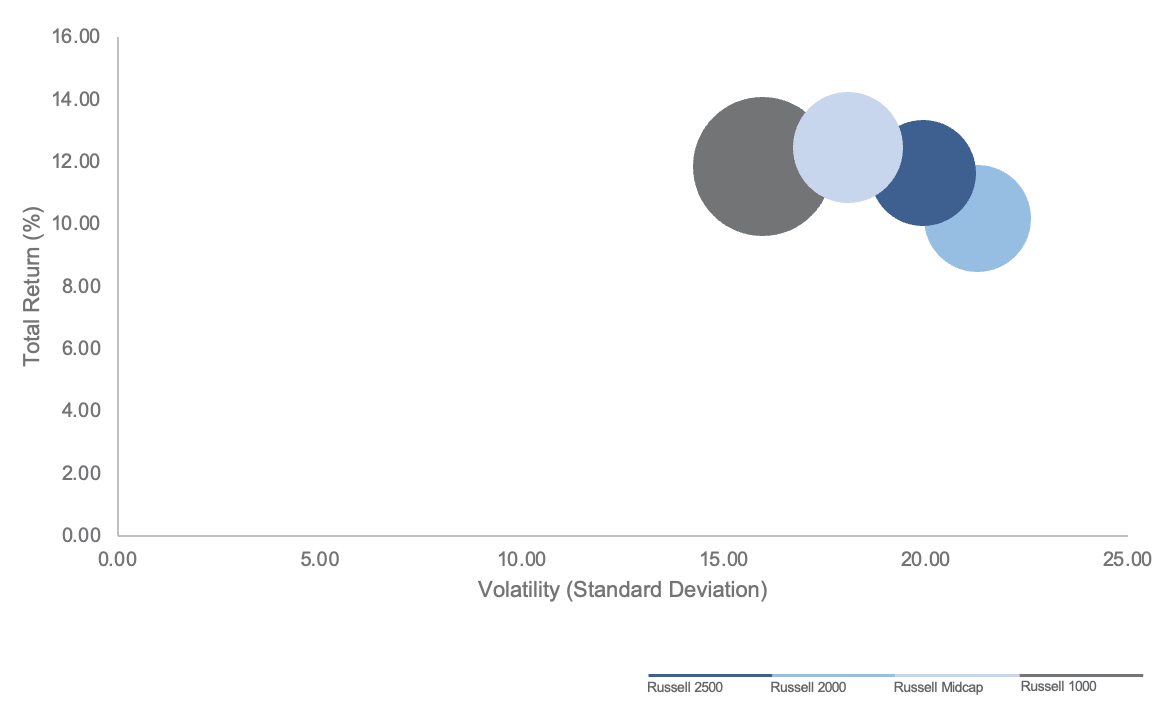
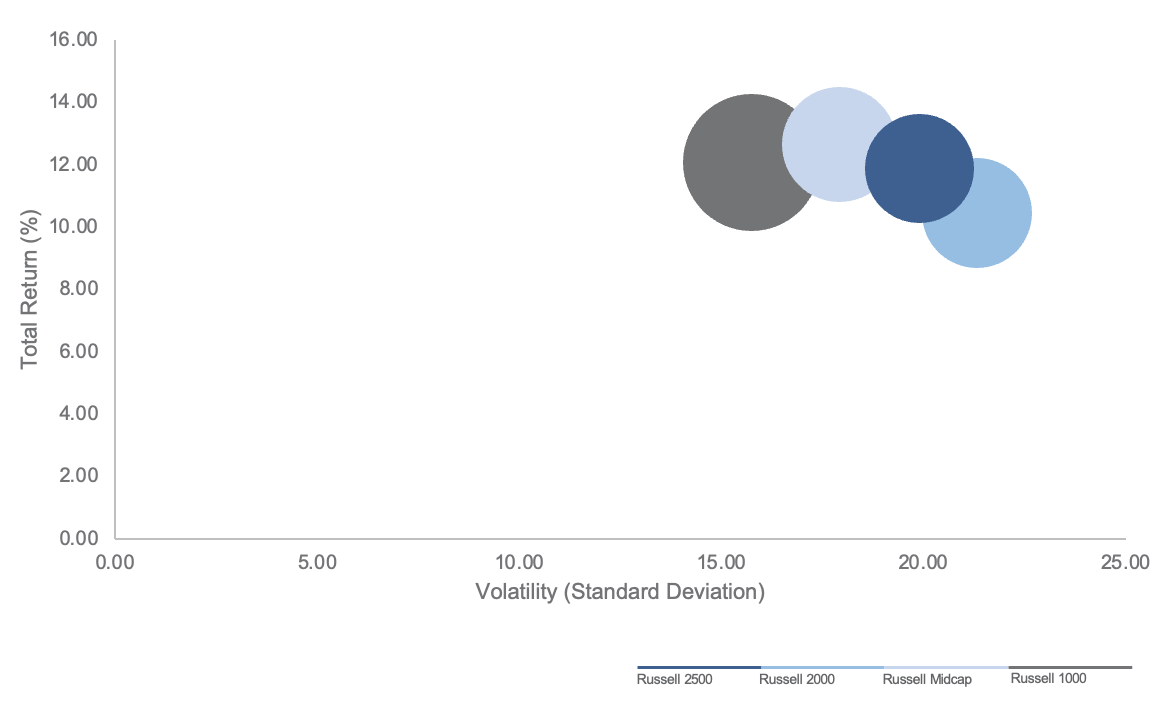
Performance is an important touchstone in the investment plan decision. Historically, the SMID-cap asset class has offered an attractiverisk/return profile, comparable to the mid-cap and small-cap asset classes.
 Typically, but not always, SMID-cap asset stocks offer higher total returns than mid-cap stocks, with lower volatility than small-cap stocks.1 While past performance is not predictive of future results, the SMID-cap asset class may be compelling for plan participants, who can benefit from the long-term growth potential of the asset class.
But, of course, performance isn’t the only factor at play. Managing costs for the plan and for plan participants should also be part of the strategy selection process. There are two primary ways to manage costs for participants: first, reduce the cost of the individual investment choices in the plan, and second, manage the number of options available to plan participants.
In the first case, passive managers will almost always be a lower-cost option for plan sponsors — active managers typically cannot match the cost-benefit of an index-replication strategy. However, there is a case for active management within a plan matrix. In certain asset classes, active managers have historically been able to provide consistent alpha relative to a common benchmark. The SMID-cap asset class is an example where active managers have been able to provide alpha over the long term.2 One reason for the performance differential could be that small- and mid-cap stocks are not as broadly covered by the analyst community as large-cap stocks, providing opportunities to outperform among the lighter analyst coverage of small- and mid-cap stocks.
SMID-Cap Managers Outperforming Index
Three-Year Rolling Periods, 2000-2023
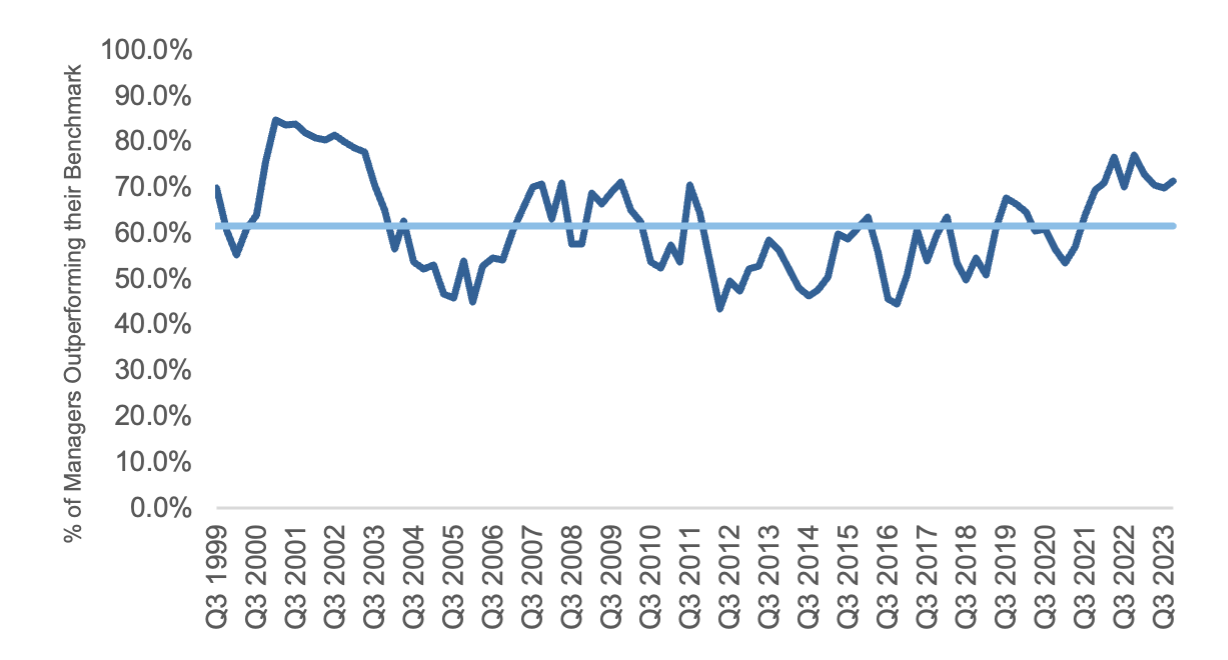
On average, 61.6% of managers outperform their designated style benchmark over rolling three-year periods, since 1997.
In 85 of 97 three-year periods since 1997, more than 50% of the managers outperformed their respective benchmark.
Five-Year Rolling Periods, 2000-2023
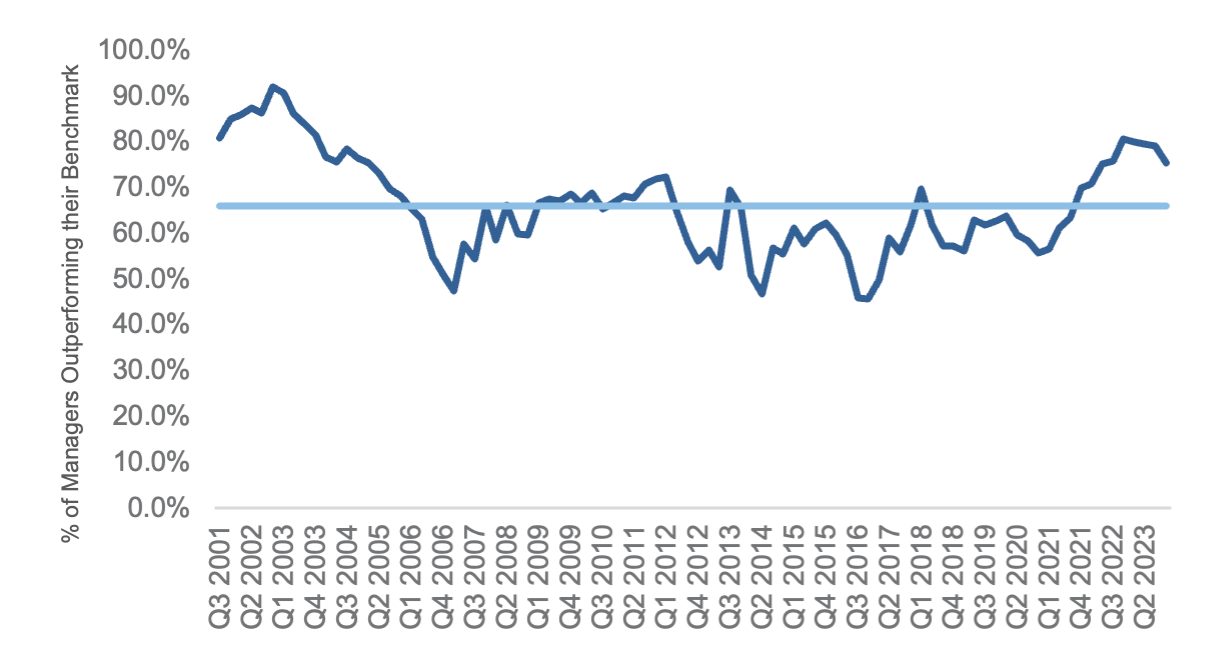
On average, 65.9% of managers beat their respective style index over rolling five-year periods since 1997.
In 84 of 89 five-year periods since 1997, more than 50% of managers outperformed their respective benchmark.
The considerations of smaller plans will necessarily be different from those of larger plans. For smaller plans, a SMID-cap strategy can be a replacement for dedicated small-cap and mid-cap options — the “two birds with one stone” alternative. Choosing a SMID-cap strategy can provide plan participants with the benefits of both small-cap stocks and mid-cap stocks in a single investment choice. It’s also simpler for plan trustees, who will review, approve and oversee fewer investment options — a SMID-cap growth and a SMID-cap value manager, for example — instead of four to six separate options. The paperwork and oversight functions are reduced, while participants still have a full array of investment options at their disposal.
There are multiple investment vehicles that are suitable for small DC plans, which offer different features and benefits to plan participants. For some micro-plans, a retail share class of a mutual fund would be most appropriate, while larger plans would qualify for an institutional share class. Even larger plans may opt for “clean” shares, which may have no up-front charges, 12(b)-1 fees or additional administrative fees.3
For larger plans, it’s about expanding the menu of options with compelling alternatives for participants. While most large plans would prefer to have multiple options for small-cap and mid-cap managers, adding SMID-cap strategies to the mix would provide even more options to plan participants. SMID-cap managers typically specialize by growth or value style exposure, allowing participants to fine-tune their investment profile. Large plans may also be able to reduce the costs of investment managers, based on the scale they bring to the table.
As for investment vehicles, SMID-cap strategies are available to larger plans as a “clean share” of a retail mutual fund, to help reduce costs to plan participants. Plans could also select a collective investment trust (CIT), a private vehicle built primarily for retirement plans. Or a plan can work with investment managers to develop a separate account, which would be entirely owned by the plan and often offers even more investment flexibility.
Characteristics of the SMID-Cap Asset Class
The quantitative case for the SMID-cap asset class rests on a simple theory. There is a larger opportunity set for investment managers, given a broader market cap range. Further, companies in the SMID-cap asset class have a much longer runway to grow into a larger market cap, so it seems self-evident that there is a greater opportunity for improved returns. But does this intuition hold up to quantitative scrutiny?
In a word, yes. SMID-cap has historically offered an attractive risk-return profile compared to small- and mid-cap stocks. SMID-cap stocks have generally outperformed small-cap stocks, while offering lower volatility than mid-cap stocks (as measured by standard deviation). Looking at three-year and five-year rolling returns for the past 40 years, capturing periods from 1980 through 2023, the return pattern is similar.
Return vs. Risk, 5-Year Rolling
1984 – 2023
Return vs. Risk, 3-Year Rolling
1982 – 2023
The wider opportunity set in the SMID-cap asset class creates the potential for greater alpha for active investment managers, expanding the small-cap index to include mid-cap stocks. This is an astounding benefit to long-term buy-and-hold investors, as managers can identify companies and follow them through a longer growth cycle, as the company matures and grows. They are not forced to sell at an artificially low market cap ceiling to meet the mandate of an investment strategy.
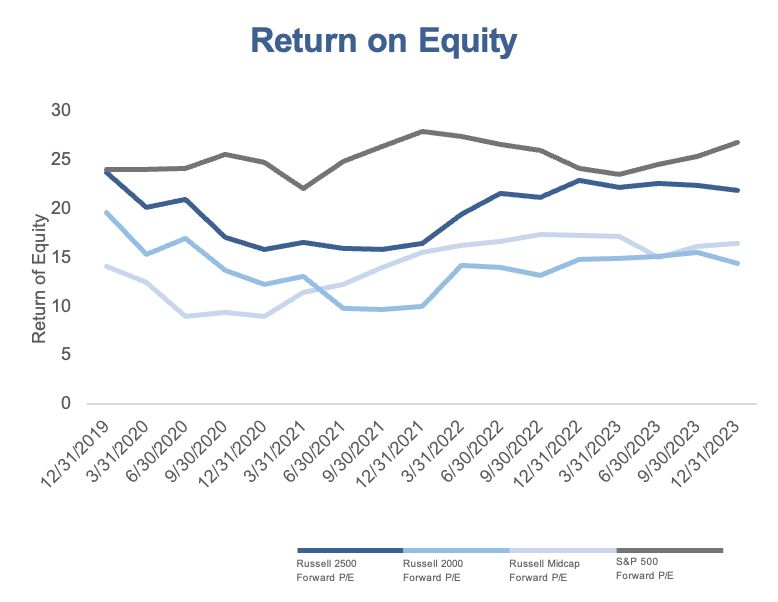
Most importantly, the addition of mid-cap stocks increases the number of quality companies for selection. Companies in the mid-cap range tend to have characteristics indicative of higher quality return on assets (ROA), return on equity (ROE) and return on invested cash (ROIC). In addition, as companies graduate from small-cap to mid-cap status, more analysts will cover the stock, as the increase in market capitalization creates greater investor attention. This is beneficial as additional analysts digging into balance sheets and financial statements can help uncover problems or issues within a company, or perhaps provide support for a controversial thesis. At the very least, additional analyst coverage may help limit the number of “surprises” that come from less-followed companies.
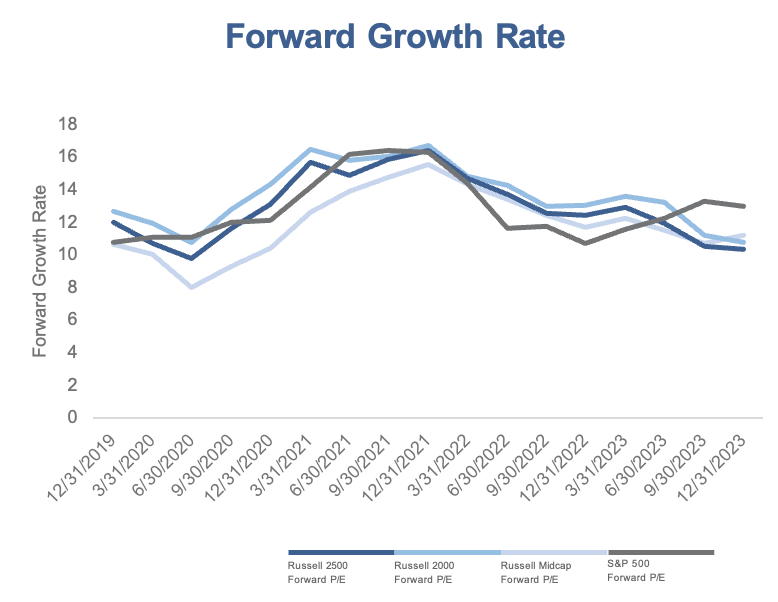
Growth and Value Characteristics of Market Cap Ranges
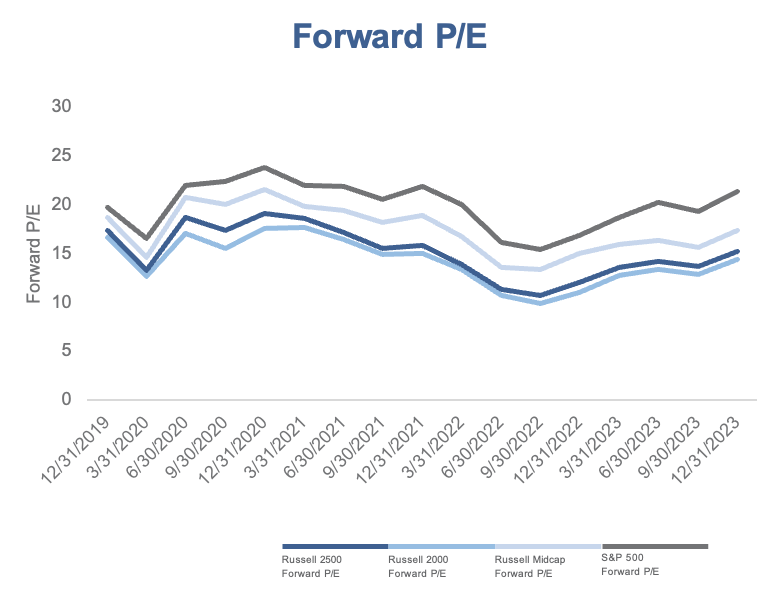
SMID-cap stocks show similar growth characteristics, attractive value and strong quality metrics compared to large-, mid- and small-cap stocks on their own.
Comparison of Selected Value Metric
12/31/2019 – 12/31/2023
Today’s Opportunity in SMID-Cap Stocks
The stock market environment may be even more attractive for the SMID-cap asset class, from a fundamental and quality perspective. Looking back, small- and mid-cap stocks recovered quickly from the COVID-19 pandemic-induced market low in March 2020. Two years after the market bottom that month, SMID-cap stocks outperformed small-, mid- and large-cap stocks. While large-caps outperformed from 2022 to 2023, driven primarily by the Magnificent 7 large-cap tech stocks, that effect seems to have waned.
| Cumulative returns | March 20, 2020 – Jan. 3, 2022 | Jan. 4, 2022 – Oct. 11, 2022 | Oct. 11, 2022 – July 31, 2023 | July 31, 2023 – Oct. 27, 2023 | Oct. 27, 2023 – March 31, 2024 |
|---|---|---|---|---|---|
| Large Cap (Russell 1000 Index) | 116.70% | -24.87% | 29.15% | -10.30% | 28.90% |
| Mid Cap (Russell Midcap Index) | 123.37% | -23.14% | 22.29% | -14.14% | 30.80% |
| SMID-Cap (Russell 2500 Index) | 130.87% | -23.00% | 20.38% | -16.14% | 31.07% |
| Small Cap (Russell 2000 Index) | 128.61% | -24.74% | 19.73% | -17.98% | 30.70% |
| 2023 | Growth | Index | Value |
|---|---|---|---|
| Large Cap (Russell 1000 Index) | 42.68% | 26.53% | 11.46% |
| Midcap (Russell Midcap Index) | 25.87% | 17.23% | 12.71% |
| SMID-Cap (Russell 2500 Index) | 18.93% | 17.42% | 15.98% |
| Small Cap (Russell 2000 Index) | 18.66% | 16.93% | 14.65% |
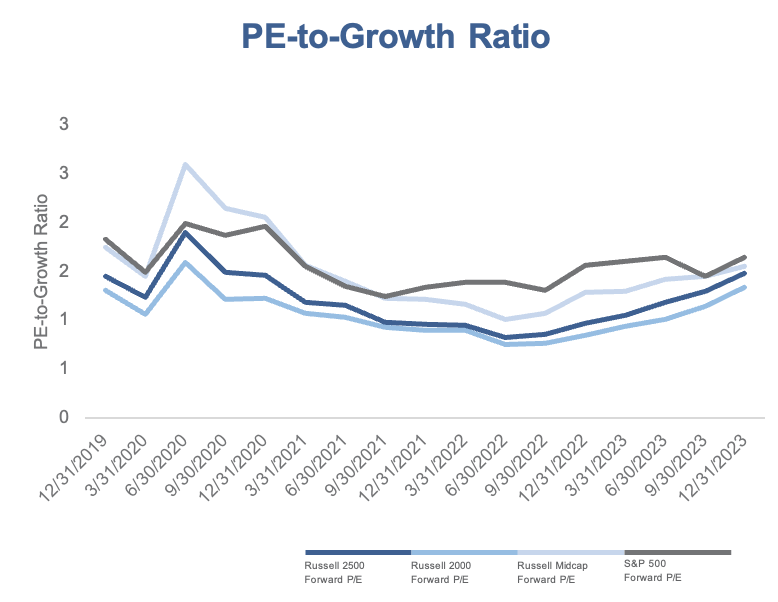
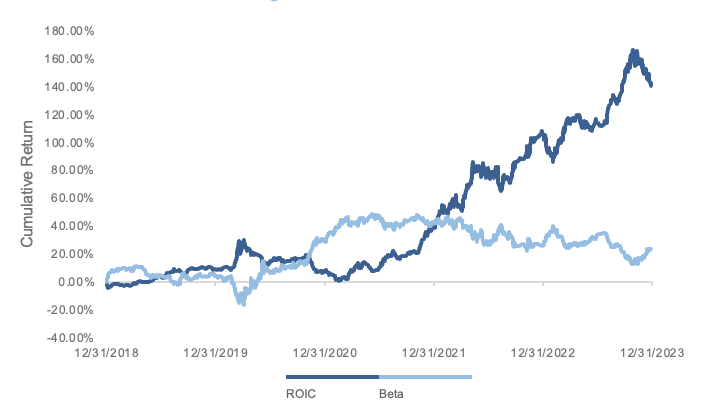
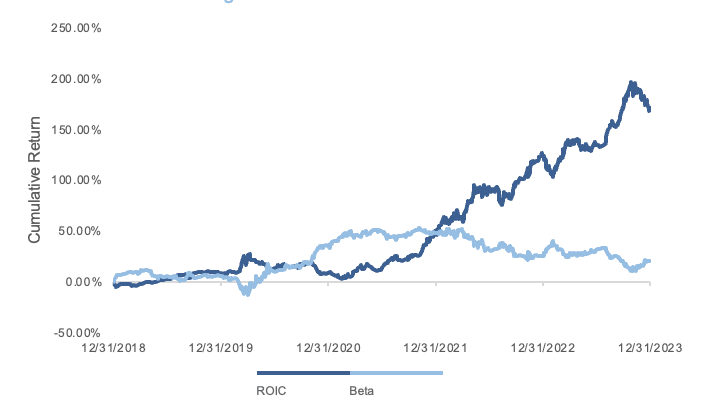
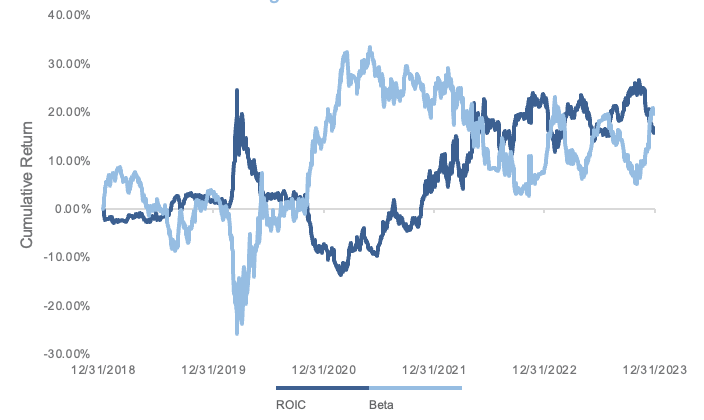
From a valuation perspective, SMID-cap stocks are trading at a more attractive multiple compared to small- and large-cap stocks, indicating greater value. Moreover, quality is also a factor, as a significant number of companies in the small-cap index are lower quality, which can be defined as a company with a volatile stock price, no earnings, or weak returns on invested capital, for instance. Over the long term, the quality factors tend to prevail — and the split is even more pronounced among smaller-cap stocks.
Russell 2500 Factor Returns
Trailing Five Years as of 12/31/2023
Russell 2000 Factor Returns
Trailing Five Years as of 12/31/2023
Russell MidCap Index Factor Returns
Trailing Five Years as of 12/31/2023
The fundamentals of the SMID-cap asset class are strong, such as a broader opportunity set, greater analyst coverage and an attractive long-term risk-return profile. It’s no wonder many DC plans are considering switching from dedicated small-cap and mid-cap sleeves to a simpler SMID-cap allocation. Today’s market environment, where small-cap stocks are undervalued relative to large-caps, represents a good time to begin that allocation process. Moreover, given the concerns about unprofitable companies gaining ground at the expense of quality companies with earnings growth, it may be a better time than ever to transition from a small-cap mandate to a SMID-cap mandate.
A Quality-Focused SMID-cap Option
There are many considerations when researching managers for SMID-cap investment strategies within your DC plan. Among these would be the consistency of the investment process, the longevity of the management team and the expectations for future performance. Another key decision point is active versus passive management, and investment manager fees play into that decision point. Product structure is an important consideration, in that plans need a structure that makes sense from a cost and services perspective. Westwood SMidCap Value strategy should be a candidate for DC plans, based on the consistency of process and investment style, its history of competitive performance and the availability of multiple structures to meet your plan’s needs.
Investment Process
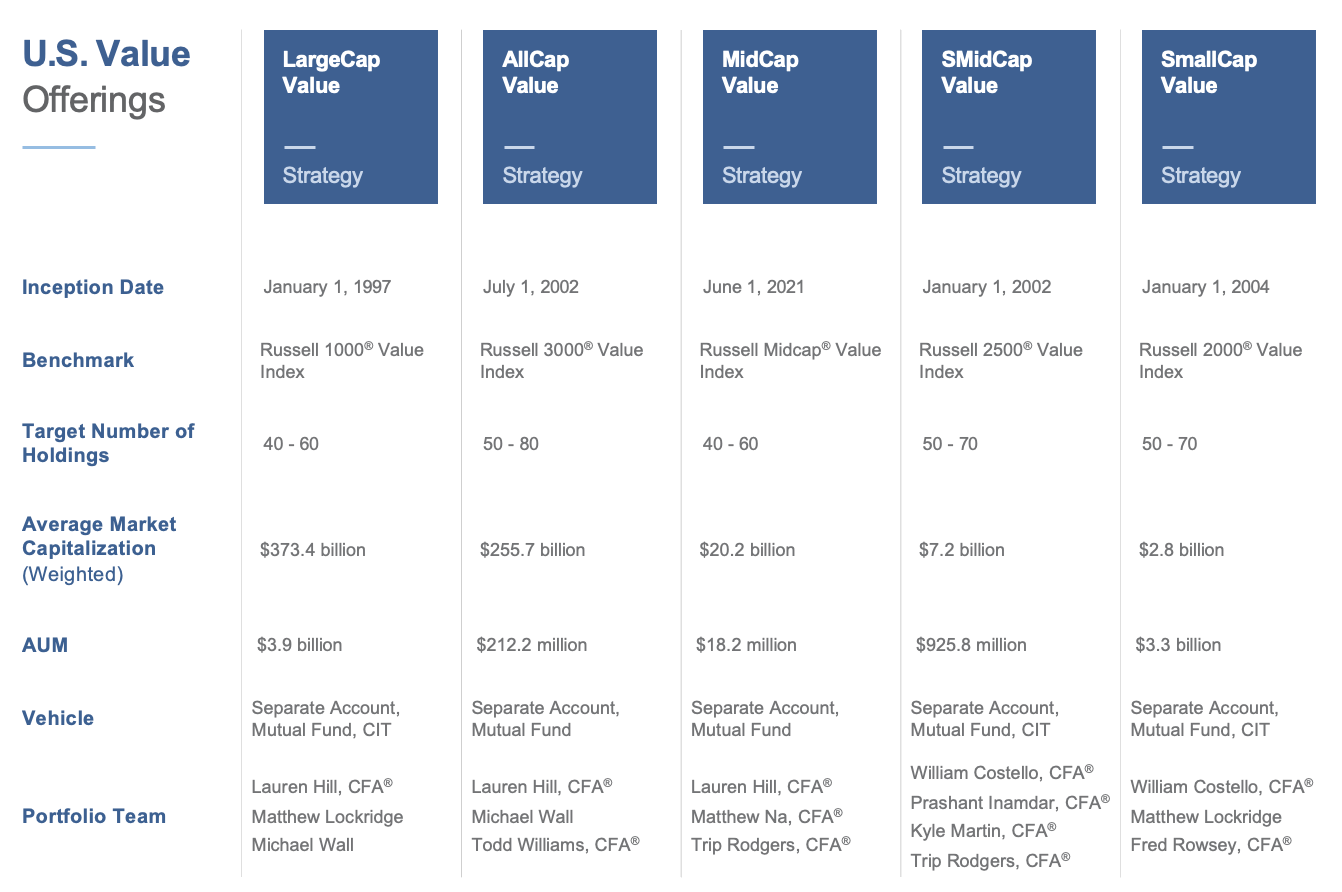
Westwood’s U.S. Value Equity team launched the SMidCap Value strategy in January 2002, creating a separate and distinct strategy dedicated to small- and mid-cap stocks, rather than allowing the SmallCap Value strategy to extend its capacity and “grow” into the mid-cap segment. Our bottom-up research process allows sector and industry analysts to focus on high-quality businesses across the market cap spectrum, giving the managers ample opportunities to select stocks for the portfolio. The strategy includes small-caps, mid-caps and larger-cap “fallen angels” that trade below their intrinsic value,4 up to about $15 billion in market cap.5
Westwood’s research process focuses on finding companies at the intersection of quality and value, where we believe a return premium exists with limited absolute downside risk, available across the entire market cap spectrum, from small- to large-cap companies. We seek to invest in businesses with management depth, longer operating histories, better access to capital and a greater ability to scale their businesses. We believe companies that meet our investment criteria can more readily adapt to changing business conditions or competitive threats, which we feel are essential traits to surviving and thriving as market dynamics and conditions evolve.
Moreover, our process and portfolio construction may help reduce volatility over the long term. Selecting stocks with quality and value characteristics provides a margin of safety — an important point, particularly in the small-cap market, where stocks tend to be more volatile. The margin of safety is typically defined as the difference between intrinsic value and market value. Intrinsic value is represented by many things, such as discounted cash flows, dividends to be paid by a company, the physical assets of the company or even the value of a brand name. Market value is the current value of the stock, or better yet, the value an acquirer would pay to purchase the entire company. Part of the Westwood research process involves defining a company’s intrinsic value, and our discipline focuses on purchasing stocks where the market value is significantly less than the intrinsic value — and there lies the margin of safety.
Investment Team
The SMidCap team managing Westwood’s strategy has nearly 30 years of combined experience managing the strategy, helping shepherd the portfolio through both bull and bear markets. Each manager is also part of the investment analyst team, with their own area of coverage, seeking to identify companies with the quality and value characteristics for which Westwood is well-known.
The investment team is organized by industry coverage, rather than by market capitalization, which provides analysts with a deeper understanding of the dynamics and nuances in each industry. There are no screens or strict guidelines to add or eliminate businesses to an analyst’s coverage; rather, each analyst is empowered to evaluate their respective industries and seek businesses with quality characteristics, and an attractive intrinsic value relative to their potential. Our modern approach to value culminates in a report to the entire team for each business in a coverage area, with upside and downside targets supported by the analyst’s detailed modeling and forecasts.
From this pool of investment candidates, the managers of the SMidCap Value strategy create a portfolio. The process has remained similar for more than a decade, with continuity of analysis and process one of the key hallmarks of the strategy. Given the volatility of the asset class, the managers will prioritize a quantitative assessment of downside risk, to mitigate against the loss of capital. The selection process results in a portfolio of 45 to 75 stocks, with high conviction but also managed to precise tracking error and risk targets.
Over time, the strategy has provided attractive performance relative to its benchmark and its peer group.
| 1Q24 | YTD | 1 Yr | 3 Yrs | 5 Yrs | 10 Yrs | Since Inception | |
|---|---|---|---|---|---|---|---|
| Westwood SMidCap Value Composite – Gross Inception: 12/31/2001 |
8.18% | 8.18% | 24.06% | 8.44% | 11.73% | 8.33% | 12.17% |
| Westwood SMidCap Value Composite – Net Inception: 12/31/2001 | 7.98% | 7.98% | 23.15% | 7.63% | 10.88% | 7.46% | 11.46% |
| Russell 2500® Value Index | 6.07% | 6.07% | 21.33% | 5.36% | 9.38% | 7.68% | 9.06% |
| Relative (+/-) | 2.11% | 2.11% | 2.73% | 3.08% | 2.35% | 0.65% | 3.11% |
Structures
Westwood understands that not all DC plans or participants are created equal and there is no one-size-fits-all solution. That’s why there are several options available to plans and institutional investors, based on the number of participants and the servicing requirements of your plan. Fees will, of course, vary, and that will have some impact on performance, but there is a product structure available to suit your needs.
| Product Structure | Plan Size | Customization | Investment Minimum | Expense Ratio (Net) | Servicing Fee |
|---|---|---|---|---|---|
| Collective Investment Trust | Large – Mega | No | None | 57 bps | |
| Separate Account | Large | Yes | $25m | 75 bps on first $50 million | |
| Ultra Share | Large | No | $1m | 68 bps | 0 bps |
| Institutional Share | Small – Medium | No | $100k | 86 bps | 20 bps |
Ultra Shares are built exclusively for defined contribution plans.
Conclusion
The SMID-cap asset class is no longer a “tweener” option destined to be overlooked by plan administrators and participants. Today’s SMID-cap strategies can take advantage of a historic sweet spot between small-cap and large-cap strategies, augmenting a traditional small-cap allocation with a segment of mid-cap stocks, resulting in a combination that offers better long-term returns with lower risk.
Moreover, today’s market environment speaks to the greater need for the SMID-cap asset class in DC plans. Returns and risk are an obvious attraction, but valuation metrics speak to the need for a greater allocation. Underlying business quality is another desirable characteristic, as historically, quality businesses have outperformed. Greater quality may be available in a SMID-cap allocation than in a pure small-cap strategy.
As you search for a SMID-cap strategy, remember that Westwood offers a strategy that we believe can meet the needs of your DC plan. With a long-tenured team overseeing a strategy that is consistent in its application and fundamental in its approach, the Westwood SMidCap Value strategy may be an attractive option for participants in your DC plan.
Westwood | Strategies
Data as of 3/31/2024
Disclosure
Past performance is not indicative of future results. The information contained herein represents the views of Westwood Management Corp. at a specific point in time and is based on information believed to be reliable. No representation or warranty is made concerning the accuracy or completeness of any data compiled herein. Any statements non-factual in nature constitute only current opinion, which is subject to change. Any statements concerning financial market trends are based on current market conditions, which will fluctuate. All information provided herein is for informational purposes only and is not intended to be, and should not be interpreted as, an offer, solicitation, or recommendation to buy or sell or otherwise invest in any of the securities/sectors/countries that may be mentioned. In addition, there can be no guarantee that any projection, forecast or opinion in these materials will be realized. These materials are provided for informational purposes only.
The charts, data and statistics where indicated herein show portfolio characteristics, evaluation measures and delta and regional, sector, credit and/or currency breakdown for the representative account as of the period end date. The representative account was selected by the firm as it was deemed to best represent this strategy. Portfolio characteristics, evaluation measure and delta, regional, sector, credit and currency breakdown, and holdings may vary from account to account, subject to any client-imposed restrictions. Westwood’s analysts closely monitor the securities held in our portfolios. Should a company’s underlying fundamentals or valuation measures change, Westwood may re-evaluate its position and may sell part or all of its positions. Data Source: Westwood Management Corp., Bloomberg, FactSet Research Systems, Inc. and KYNEX. All Rights Reserved.
The Global Industry Classification Standard (“GICS”) was developed by and is the exclusive property and a service mark of MSCI Inc. (“MSCI”) and Standard & Poor’s, a division of The McGraw-Hill Companies, Inc. (“S&P”), and is licensed for use by Westwood Management Corp. Neither MSCI, S&P nor any third party involved in making or compiling the GICS or any GICS classifications makes any express or implied warranties or representations with respect to such standard or classification (or the results to be obtained by the use thereof), and all such parties hereby expressly disclaim all warranties of originality, accuracy, completeness, merchantability and fitness for a particular purpose with respect to any of such standard or classification. Without limiting any of the foregoing, in no event shall MSCI, S&P, any of their affiliates or any third party involved in making or compiling the GICS or any GICS classifications have any liability for any direct, indirect, special, punitive, consequential or any other damages (including lost profits) even if notified of the possibility of such damages.