As of March 31, 2026, overall Morningstar rating against 208 funds in the Allocation – Moderately Conservative category based on risk-adjusted return
Objective
The Westwood Income Opportunity Fund (the “Fund”) seeks to provide current income. A secondary objective of the Fund is to seek capital appreciation.
Fund Overview
†Blended Benchmark is 60% Bloomberg Barclays U.S. Aggregate Bond Index and 40% S&P 500 Index.
***The subsidized SEC yield is calculated with a standardized formula mandated by the SEC. The formula is based on maximum offering price per share and includes the effect of any fee waivers. Without waivers, yields would be reduced.
Assumes an initial investment of $10,000 was made on the fund's inception date of 12/19/2005. The growth of a $10,000 investment in the fund is hypothetical and for illustration only. It does not represent any actual investment.
Investors should review the Fund's Institutional Shares summary or statutory prospectus for share class eligibility requirements. The prospectuses for the Institutional, A Shares, and C Shares can be found in the Related Materials section of this web page.
| Trailing Year Performance | YTD* | 1-Yr Trailing |
3-Yrs Trailing |
5-Yrs Trailing |
10-Yrs Trailing |
Since Inception |
|---|---|---|---|---|---|---|
| Income Opportunity Fund Net of Fees | 4.93% | 13.02% | 10.58% | 4.33% | 6.38% | 6.67% |
The performance data quoted represents past performance. Past performance does not guarantee future results. The investment return and principal value of an investment will fluctuate so that an investor’s shares, when redeemed, may be worth more or less than their original cost and current performance may be lower or higher than the performance quoted. For performance data current to the most recent month end, please call +1 (877) FUND-WHG. *YTD figure is calculated as of the most recent month end.
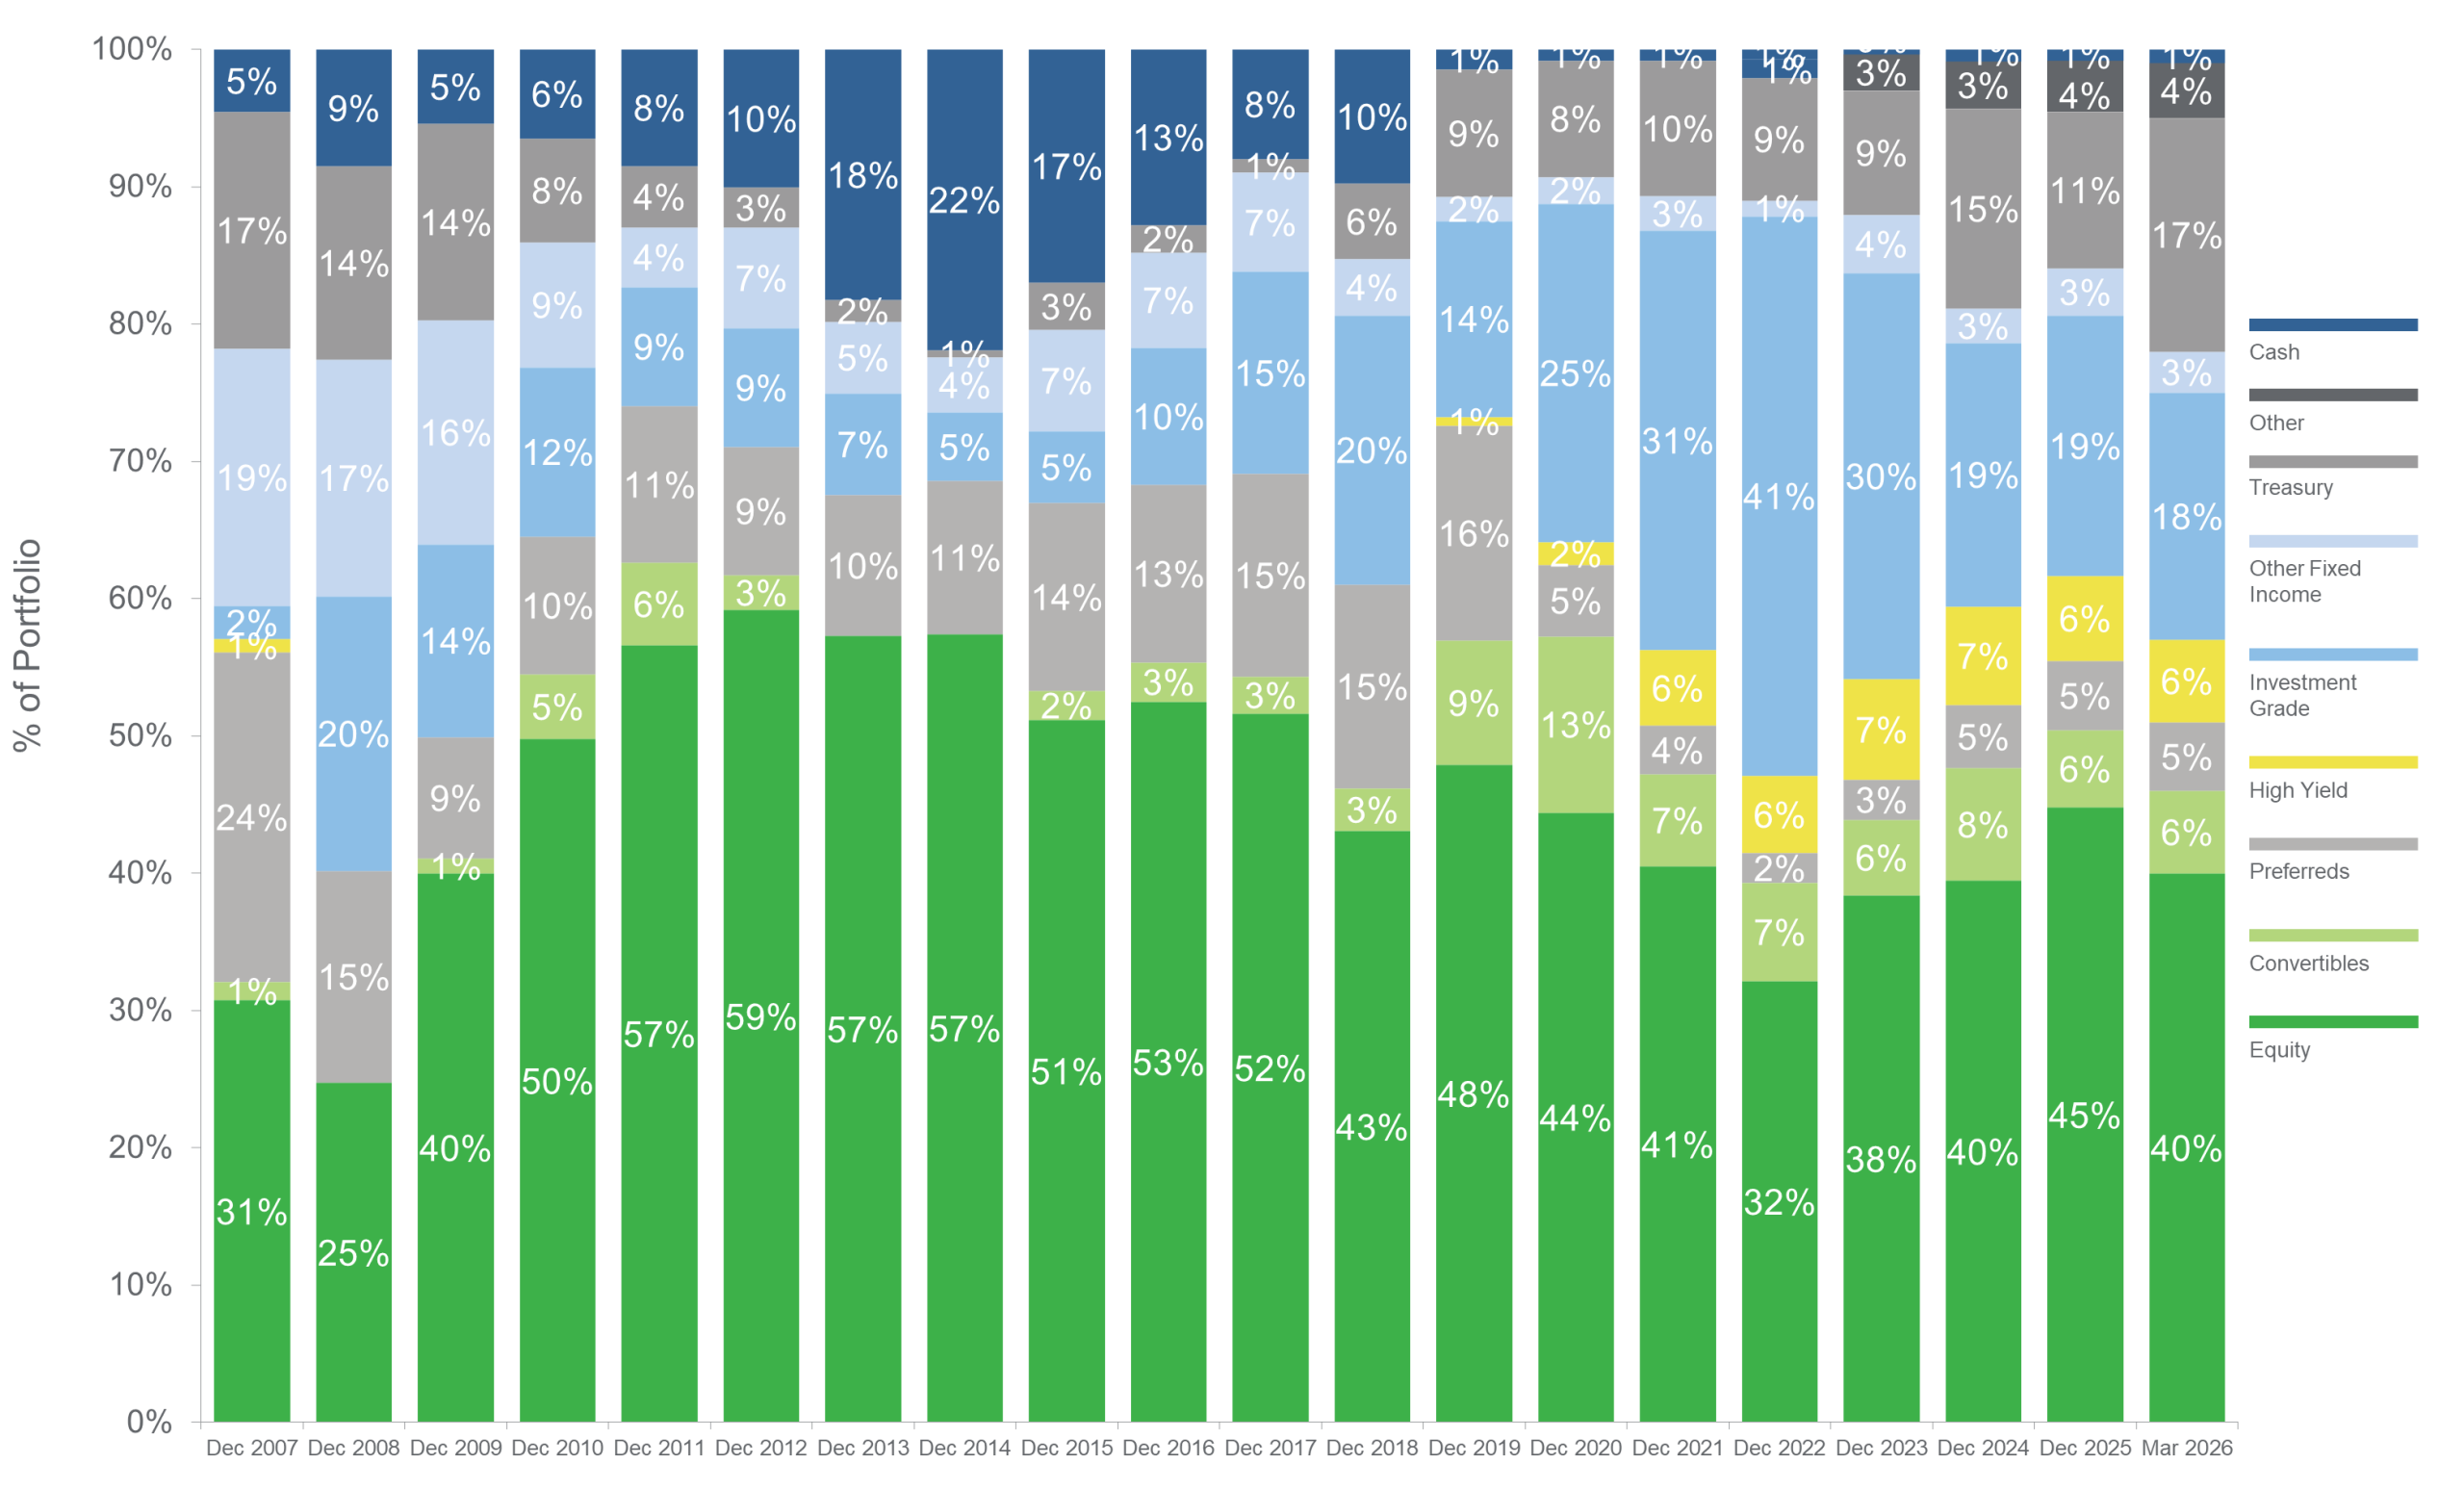
Data as of March 31, 2026. Please note that each column may not add to 100% due to rounding. Asset Allocation for 2006 to present represents the Westwood Income Opportunity mutual fund allocation. Holdings subject to change.
![]()
![]()
![]()
![]()
Information is for the institutional share class only; other classes may vary.
Bonds and bond funds will decrease in value as interest rates rise. High yield bonds are highly speculative and carry a greater degree of risk. High yield bonds held by the fund are subject to greater credit risk, which raises the potential likelihood for the bonds to default on principal and interest payments. REIT investments are subject to changes in economic conditions, credit risk and interest rate fluctuations. Investments in securities of MLPs involve risk that differ from investments in common stock including risks related to limited control and limited rights to vote on matters affecting the MLP. MLP common units and other equity securities can be affected by economic and other factors affecting the stock market in general, expectations of interest rates, investor sentiment towards MLPs or the energy sector, changes in a particular issuer’s financial condition, or unfavorable or unanticipated poor performance of a particular issuer. There can be no assurance that the Fund will achieve its stated objectives. A company may reduce or eliminate its dividend, causing losses to the fund. Diversification does not protect against market loss.
The Morningstar Rating™ for funds, or “star rating”, is calculated for managed products (including mutual funds, variable annuity and variable life subaccounts, exchange-traded funds, closed-end funds, and separate accounts) with at least a three-year history. Exchange-traded funds and open-ended mutual funds are considered a single population for comparative purposes. It is calculated based on a Morningstar Risk-Adjusted Return measure that accounts for variation in a managed product’s monthly excess performance, placing more emphasis on downward variations and rewarding consistent performance. The Morningstar Rating does not include any adjustment for sales load. The top 10% of products in each product category receive 5 stars, the next 22.5% receive 4 stars, the next 35% receive 3 stars, the next 22.5% receive 2 stars, and the bottom 10% receive 1 star. The Overall Morningstar Rating for a managed product is derived from a weighted average of the performance figures associated with its three-, five-, and 10-year (if applicable) Morningstar Rating metrics. The weights are: 100% three-year rating for 36-59 months of total returns, 60% five-year rating/40% three-year rating for 60-119 months of total returns, and 50% 10-year rating/30% five-year rating/20% three-year rating for 120 or more months of total returns. While the 10-year overall star rating formula seems to give the most weight to the 10-year period, the most recent three-year period actually has the greatest impact because it is included in all three rating periods.
As of 3/31/2026: WHGIX was rated against the following numbers of Allocation – moderately conservative category funds over the following time periods: 208 funds in the last three years, 199 funds in the last five years and 164 funds in the last ten years. With respect to these Allocation – moderately conservative category funds, WHGIX received a Morningstar Rating of 3 of 5 stars for the three-year period, 3 of 5 stars for the five-year period and 4 of 5 stars for the ten-year period.
©2026 Morningstar, Inc. All Rights Reserved. The information contained herein: (1) is proprietary to Morningstar and/or its content providers; (2) may not be copied or distributed; and (3) is not warranted to be accurate, complete or timely. Neither Morningstar nor its content providers are responsible for any damages or losses arising from any use of this information. Past performance is no guarantee of future results.
Westwood Funds are distributed by Ultimus Fund Distributors, LLC. (Member FINRA) Ultimus Fund Distributors and Westwood Funds (or Westwood Holdings Group, Inc.) are separate and unaffiliated.
To determine if this Fund is an appropriate investment for you, carefully consider the Fund’s investment objectives, risk factors and charges and expenses before investing. This and other information can be found in the Fund’s prospectus which may be obtained by calling +1 (877) FUND-WHG (+1 (877) 386-3944). Please read the prospectus carefully before investing.